
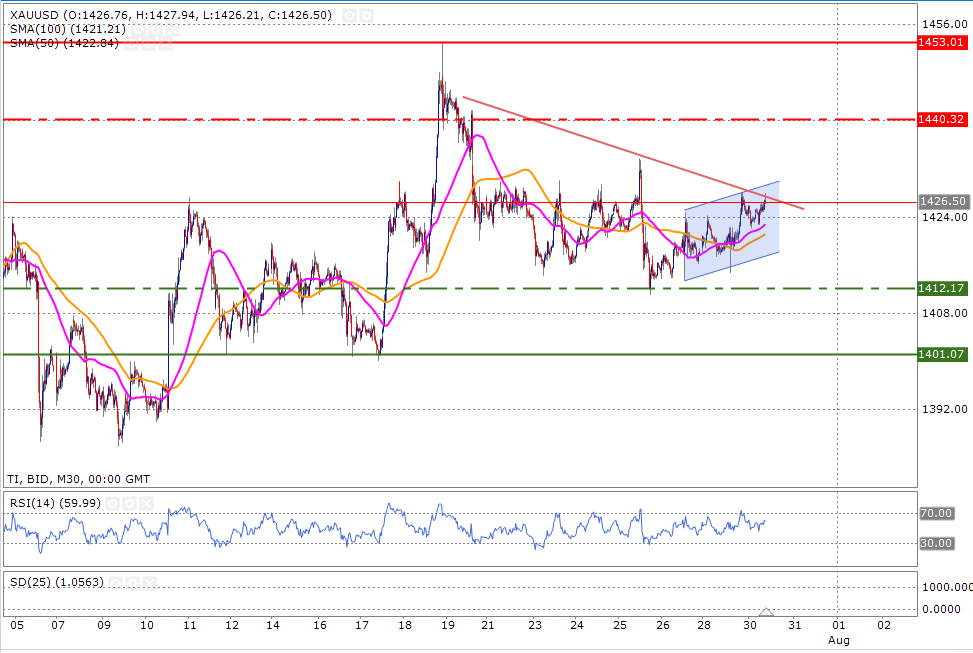
Gold price is trading in an upward channel on a 30 minute time frame, an intra-day time frame for day traders. On a daily frame, the uptrend is still in place as the price is trading above the two important moving averages: 50-day and 100-day (50 shown in pink and 100 in orange).
The gold price is also trading above these moving averages on the current (30 min) time frame and this further strengthens the bull case. However, it is important to note that the price is going to face some difficulty or perhaps some retracement as it comes closer to the downward trend line shown in dark brown colour. However, if the price breaks this trend line to the upside, it means that the odds would be stronger for this bull move to continue its move.
The RSI is also approaching its oversold reading and traders do use this reading as an opportunity to sell. So, the current upward move which is likely to face resistance near the downward trend line isn’t that strong as it appeared before.
Minor support 1,412
Major support 1,401
Minor resistance 1,440
Major resistance 1,453


