
The EUR/USD currency pair
Technical indicators of the currency pair:
Prev Open: 1.11795
Open: 1.11978
% chg. over the last day: +0.07
Day’s range: 1.11965 – 1.12112
52 wk range: 1.1034 – 1.1817
The EUR/USD currency pair is still in a sideways movement. The technical picture is ambiguous. The trading tool tests local support and resistance levels: 1.11800 and 1.12150, respectively. Participants in financial markets expect additional drivers. EUR/USD can grow further. We recommend that you keep track of the up-to-date information regarding the trade conflict between the United States and China. Positions must be opened from the key levels.
The Economic News Feed for 12.08.2019 is calm.
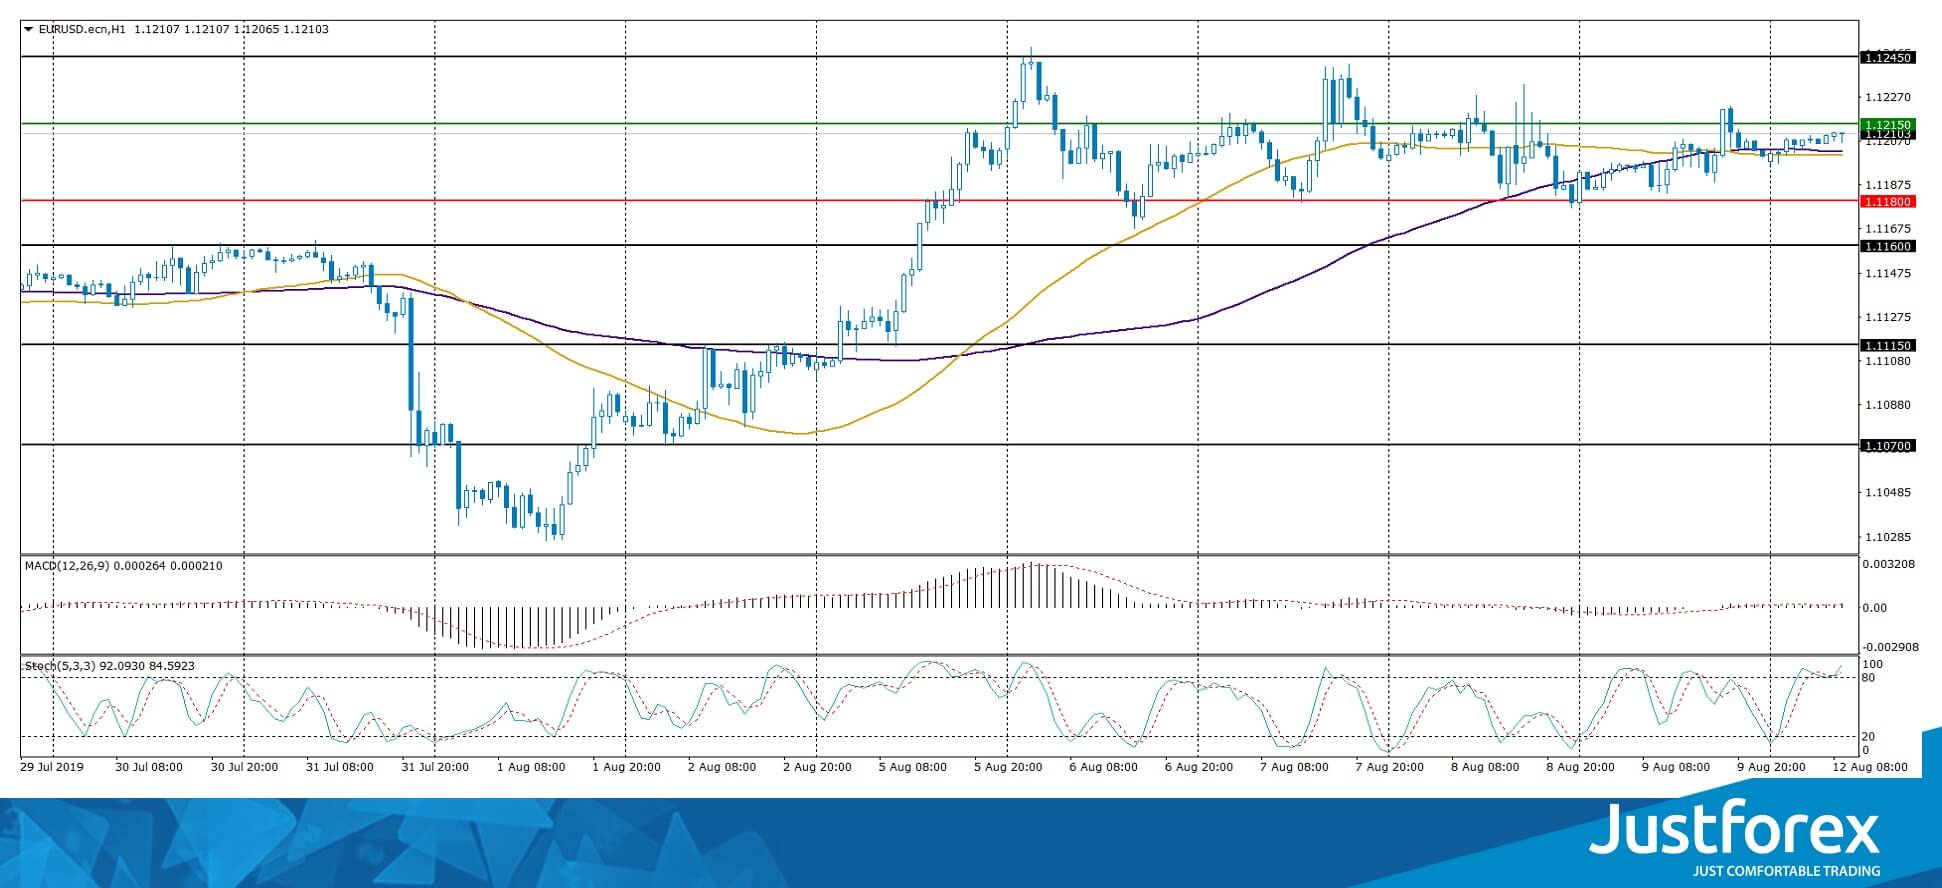
Indicators do not give accurate signals, 50 MA has crossed 100 MA.
The MACD histogram is close to 0.
The Stochastic Oscillator is in the overbought zone, the %K line has crossed the %D line. There are no signals at the moment.
Trading recommendations
Support levels: 1.11800, 1.11600, 1.11150
Resistance levels: 1.12150, 1.12450, 1.12800
If the price consolidates above 1.12150, expect further growth toward 1.12450-1.12600.
Alternatively, the price could decrease toward 1.11500-1.11400.
The GBP/USD currency pair
Technical indicators of the currency pair:
Prev Open: 1.21285
Open: 1.20428
% chg. over the last day: -0.78
Day’s range: 1.20145 – 1.20497
52 wk range: 1.2080 – 1.3385
GBP/USD went down again. On Friday, the drop in quotes exceeded 100 points. The trading instrument reached the two-year lows. The pressure on GBP was exerted by a number of weak economic releases from the UK. Investors continue to monitor the situation around Brexit. We do not exclude a further decline in the GBP/USD currency pair. Positions must be opened from key levels.
The Economic News Feed for 12.08.2019 is calm.
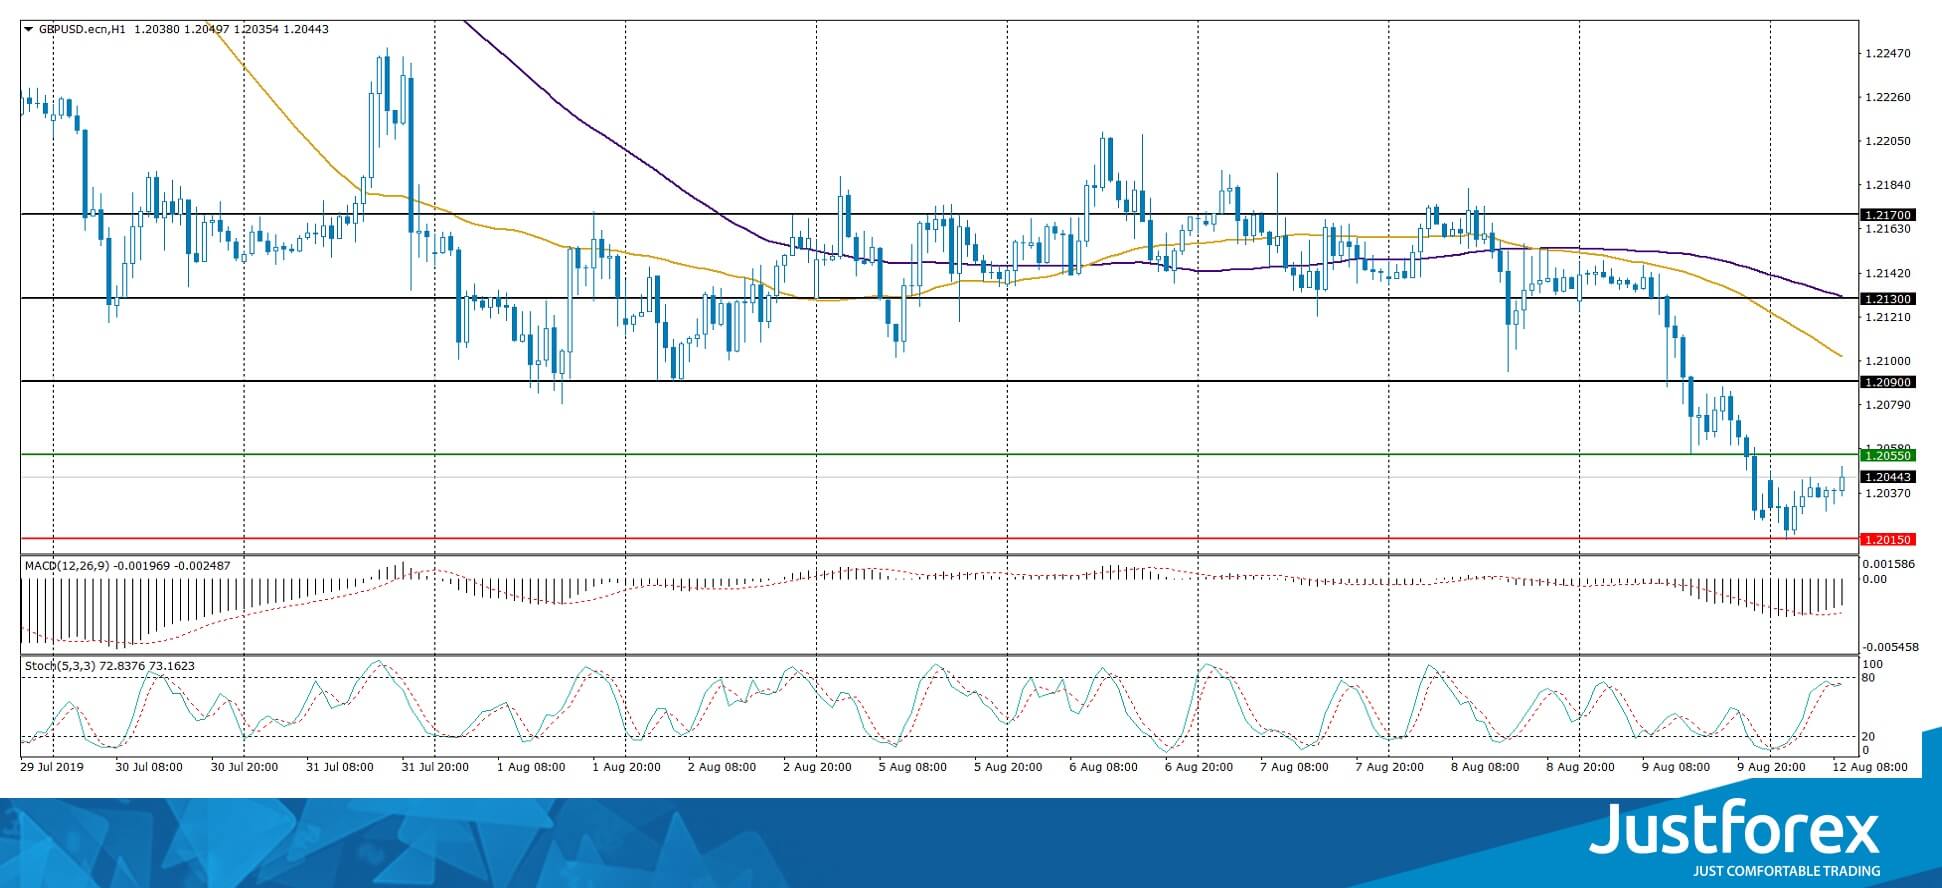
Indicators point to the strength of sellers: the price has fixed below 50 MA and 100 MA.
The MACD histogram is in the negative zone and above the signal line, which gives a weak signal to sell GBP/USD.
The Stochastic Oscillator is in the neutral zone, the %K line has crossed the %D line. There are no signals at the moment.
Trading recommendations
Support levels: 1.20150, 1.20000
Resistance levels: 1.20550, 1.20900, 1.21300
If the price consolidates below 1.20150, expect a further drop toward 1.20000-1.19600.
Alternatively, the quotes can correct toward 1.20800-1.21000.
The USD/CAD currency pair
Technical indicators of the currency pair:
Prev Open: 1.32258
Open: 1.31986
% chg. over the last day: -0.23
Day’s range: 1.31986 – 1.32282
52 wk range: 1.2727 – 1.3664
An ambiguous technical picture has developed on the USD/CAD currency pair. CAD is consolidating. At the moment, the local support and resistance levels are 1.32000 and 1.32400. Investors expect additional drivers. A trading instrument has the potential to decline further. We recommend paying attention to the dynamics of oil quotes. Positions must be opened from key levels.
The Economic News Feed for 12.08.2019 is calm.
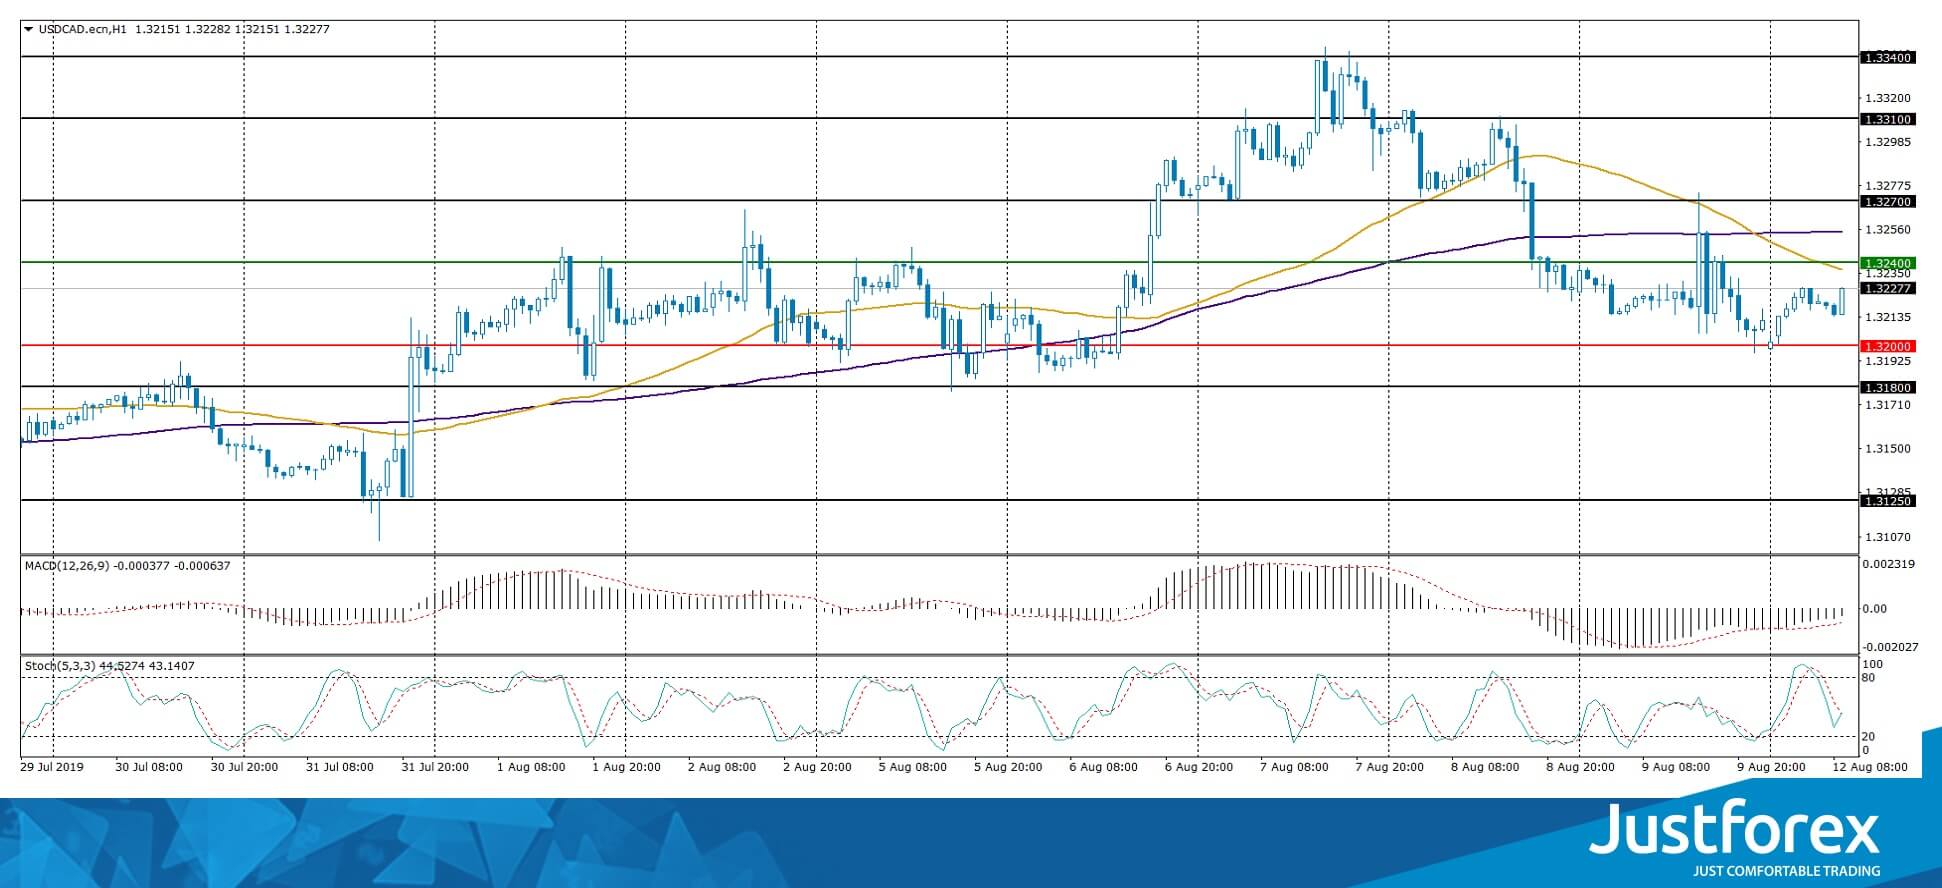
Indicators do not provide accurate signals: 50 MA has crossed 100 MA.
The MACD histogram is in the negative zone but above the signal line, which gives a weak signal to sell USD/CAD.
The Stochastic Oscillator is in the neutral zone, the %K line has crossed the %D line. There are no signals at the moment.
Trading recommendations
Support levels: 1.32000, 1.31800, 1.31250
Resistance levels: 1.32400, 1.32700, 1.33100
If the price consolidates below 1.32000, expect a further descend toward 1.31700-1.31500.
Alternatively, the quotes can grow toward 1.32700-1.33000.
The USD/JPY currency pair
Technical indicators of the currency pair:
Prev Open: 106.074
Open: 105.554
% chg. over the last day: -0.39
Day’s range: 105.311 – 105.691
52 wk range: 104.97 – 114.56
The USD/JPY currency pair is still dominated by a bearish sentiment. A trading instrument is consolidating near annual lows. Currently, local support and resistance levels are: 105,300 and 105,800, respectively. Demand for “safe” assets exists at a high level amid escalation of the trade conflict between the US and China. We recommend that you keep track of current information on this issue. Positions must be opened from the main levels.
Japan’s financial markets are closed due to the holiday.
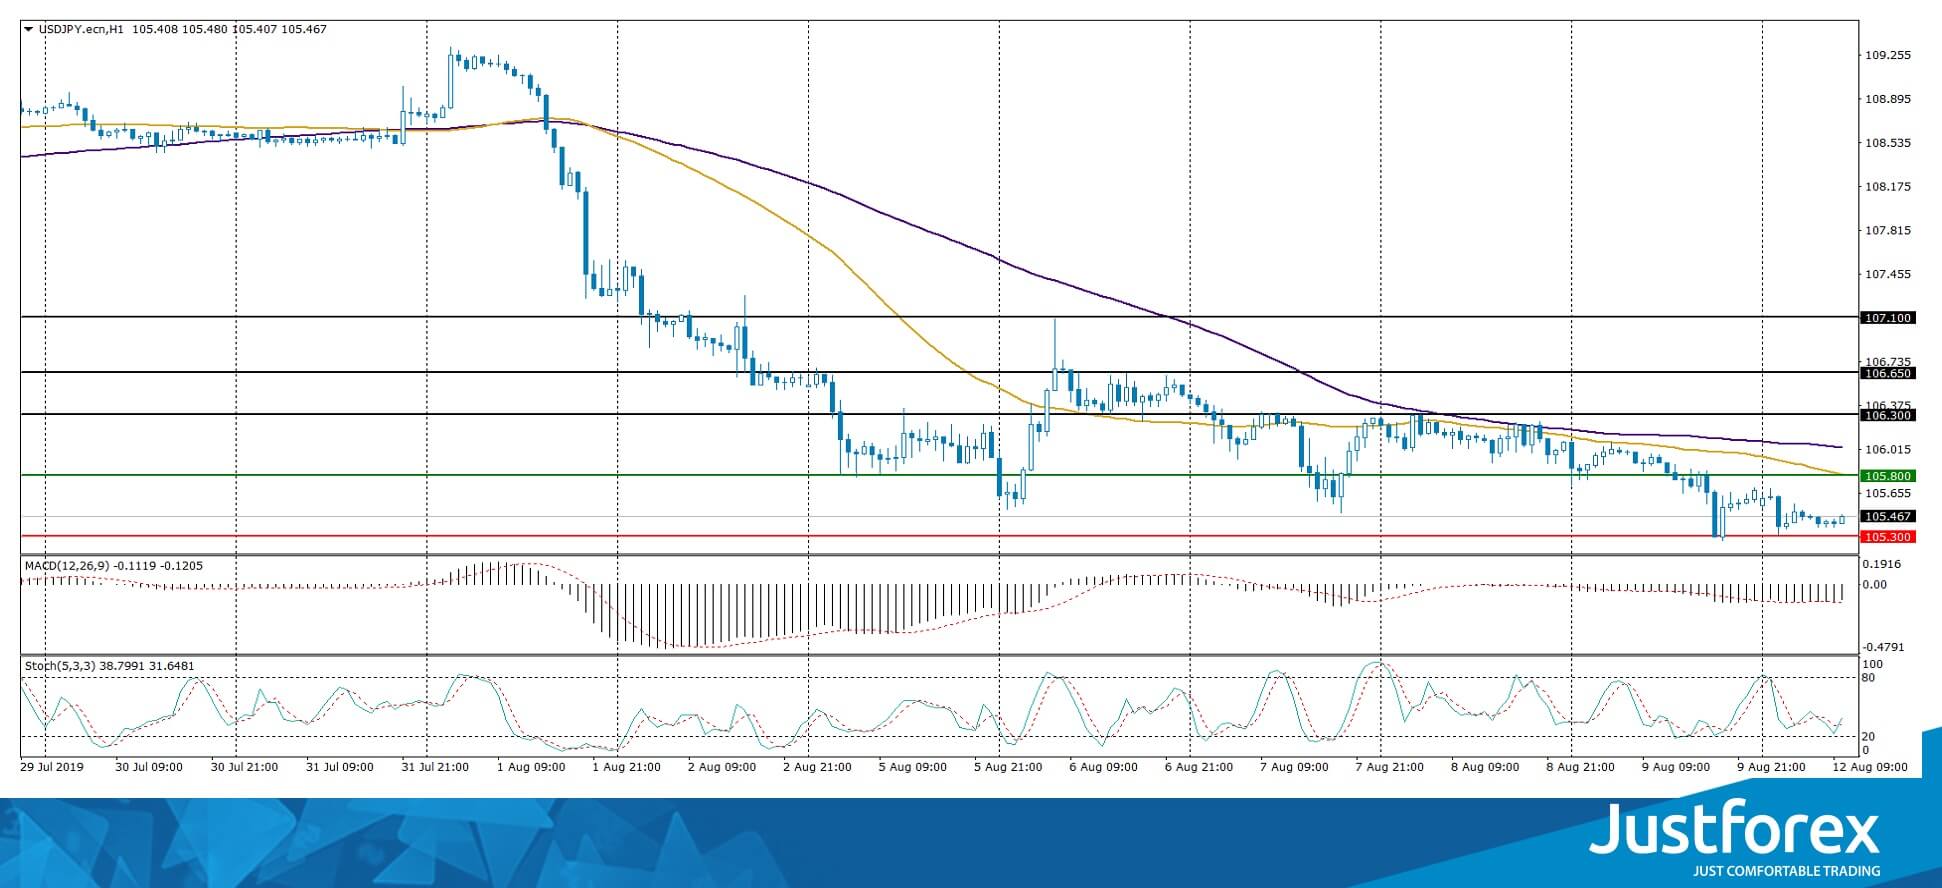
The price fixed below 50 MA and 100 MA.
The MACD histogram is in the negative zone, which indicates a bearish mood.
The Stochastic Oscillator is in the neutral zone, the %K line crossed the %D line. There are currently no signals.
Trading recommendations
Support levels: 105.300, 105.000
Resistance levels: 105,800, 106,300, 106,650
If the price consolidates below 105.300, expect a further fall toward 105.00-104.800.
Alternatively, the price could recover toward 106.200-106.400.


