
The EUR/USD currency pair
Technical indicators of the currency pair:
Prev Open: 1.10998
Open: 1.10844
% chg. over the last day: -0.09
Day’s range: 1.10767 – 1.10917
52 wk range: 1.1034 – 1.1817
The EUR/USD currency pair continues to trade in a flat. Unidirectional trends are not observed. According to the FOMC protocols, further adjustment of the monetary policy of the Fed will be determined on the basis of incoming data. Participants in the financial markets are awaiting a speech by Fed Chairman Jerome Powell at the Jackson Hole Summit on Friday. Today, investors will evaluate the minutes of the last ECB meeting, as well as a number of indicators on business activity in the EU. Positions must be opened from key levels.
The Economic News Feed for 22.08.2019:
Business activity report (GER, EU) – 10:30 (GMT+3:00);
ECB meeting minutes (EU) – 14:30 (GMT+3:00);
Initial Jobless Claims (US) – 15:30 (GMT+3:00);
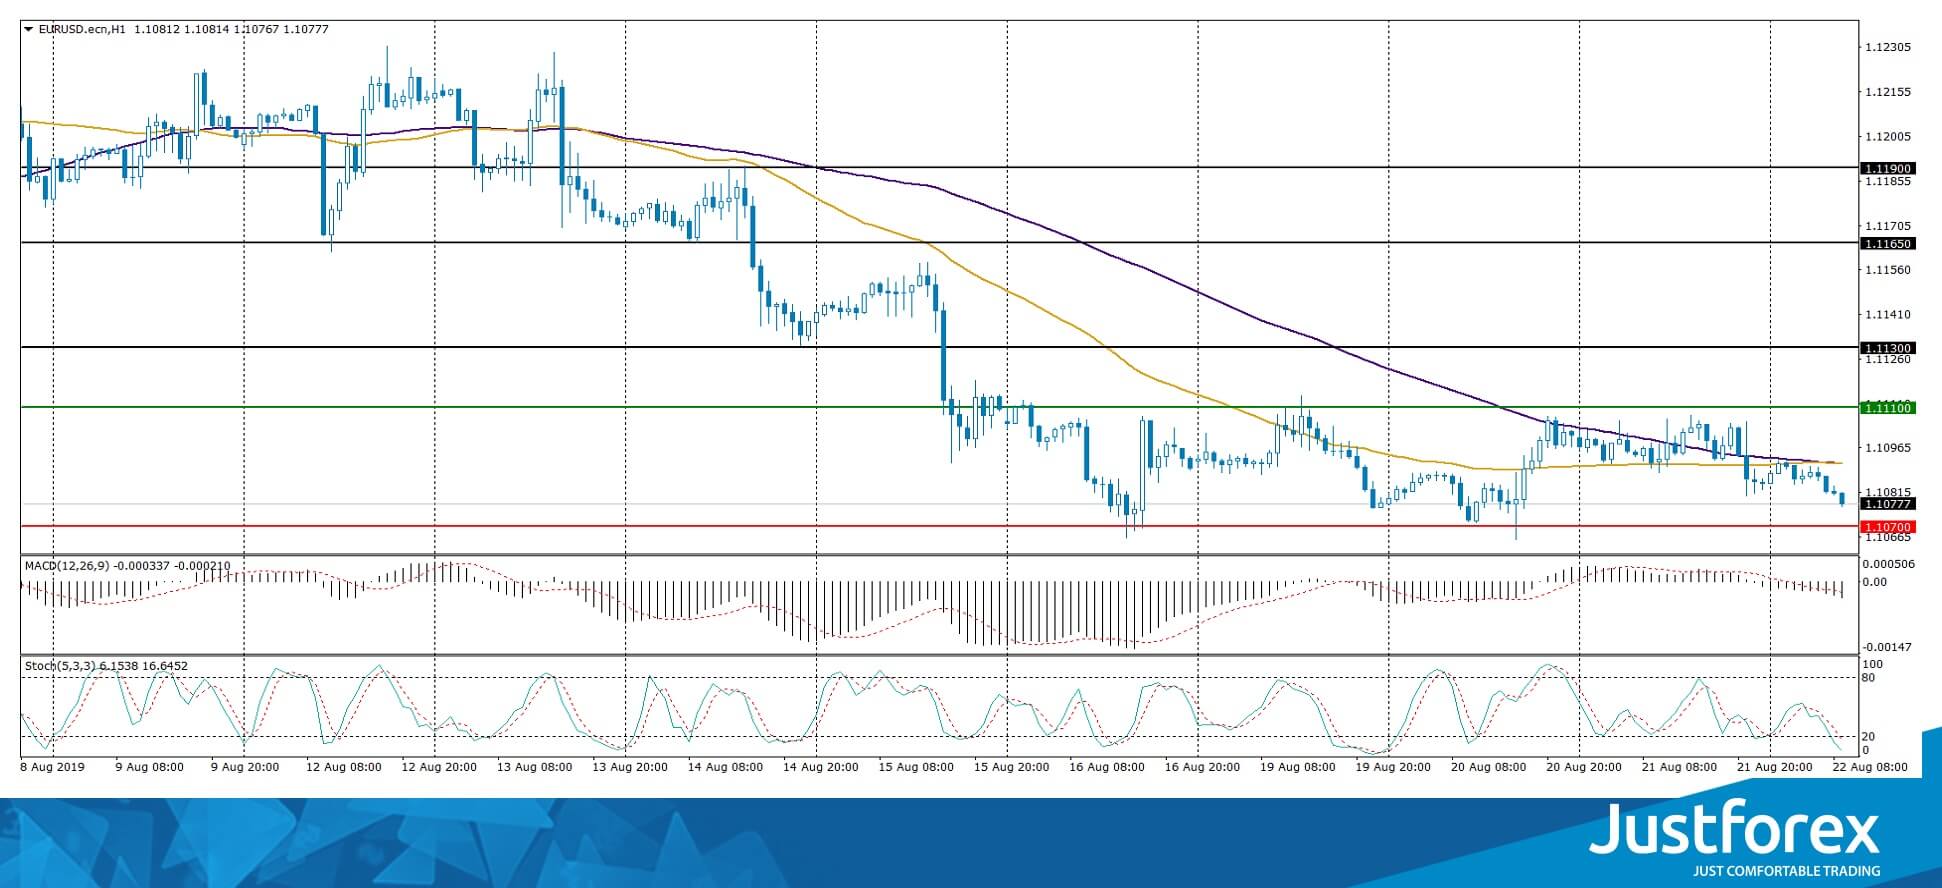
Indicators do not give accurate signals: 50 MA crossed 100 MA.
The MACD histogram is in the negative zone and below the signal line, which gives a strong signal to sell EUR/USD.
The Stochastic Oscillator is in the neutral zone, the% K line is below the% D line, which also indicates a bearish sentiment.
Trading recommendations
Support levels: 1.10700, 1.10500
Resistance levels: 1.11100, 1.11300, 1.11650
If the price consolidates above 1.11100, expect the price to correct toward 1.11300-1.11600.
Alternatively, the quotes can decrease toward 1.10400-1.10200.
The GBP/USD currency pair
Technical indicators of the currency pair:
Prev Open: 1.21698
Open: 1.21233
% chg. over the last day: -0.31
Day’s range: 1.21167 – 1.21340
52 wk range: 1.2015 – 1.3385
The technical picture on the GBP/USD currency pair remains ambiguous. The pound continues to consolidate. Investors expect additional drivers. At the moment, the local support and resistance levels are 1.21150 and 1.21450. We do not exclude further recovery of GBP/USD quotes. We recommend keeping track of current information on the Brexit issue. Positions must be opened from key levels.
The Economic News Feed for 22.08.2019 is calm.
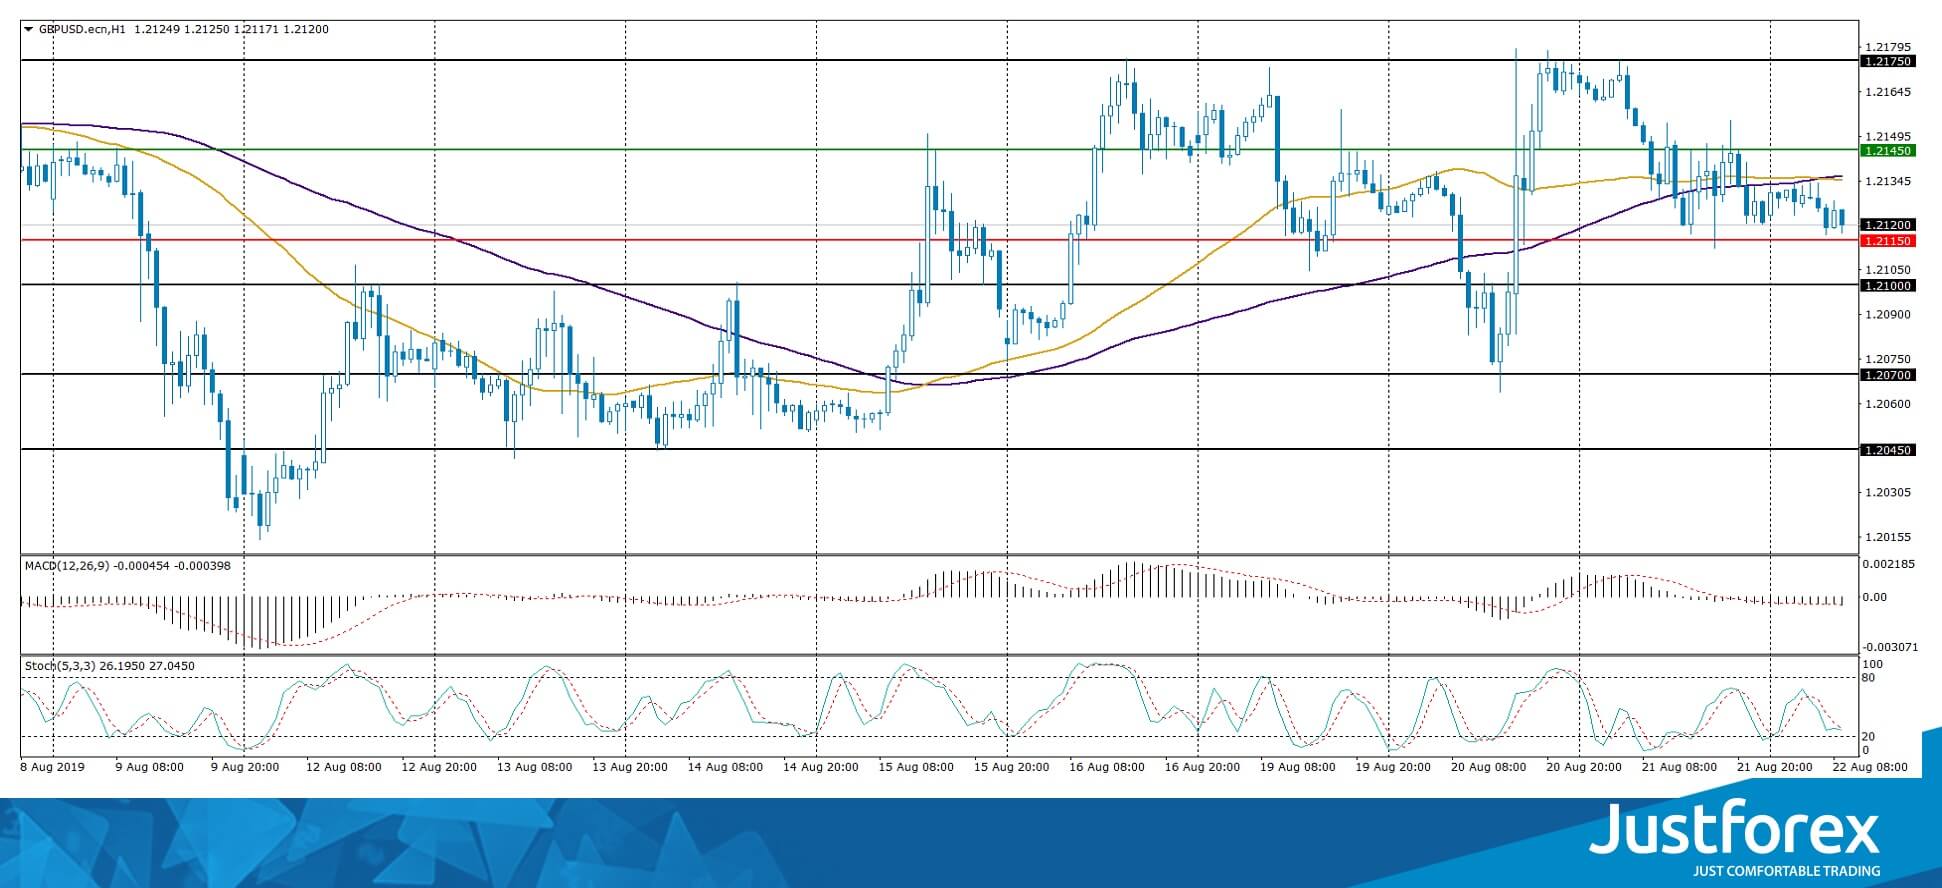
Indicators do not give accurate signals, 50 MA has crossed 100 MA.
The MACD histogram moved into the negative zone, which points to a bearish sentiment.
The Stochastic Oscillator is in the neutral zone, the% K line began to cross the% D line. There are no signals at the moment.
Trading recommendations
Support levels: 1.21150, 1.21000, 1.20700
Resistance levels: 1.21450, 1.21750, 1.22000
If the price consolidates above 1.21450, expect further growth toward 1.21750-1.22000.
Alternatively, the quotes could descend toward 1.20800-1.20600.
The USD/CAD currency pair
Technical indicators of the currency pair:
Prev Open: 1.33177
Open: 1.32849
% chg. over the last day: -0.21
Day’s range: 1.32822 – 1.33152
52 wk range: 1.2727 – 1.3664
The last trading session on the USD/CAD currency pair is very active. At the same time, there is no defined trend. CAD is trading in a flat. At the moment, the local support and resistance levels are 1.32900 and 1.33200. USD/CAD quotes can grow further. Pay attention to the dynamics of oil prices. Positions must be opened from key levels.
At 15:30 (GMT+3:00), a report on the volume of wholesale sales in Canada will be published.
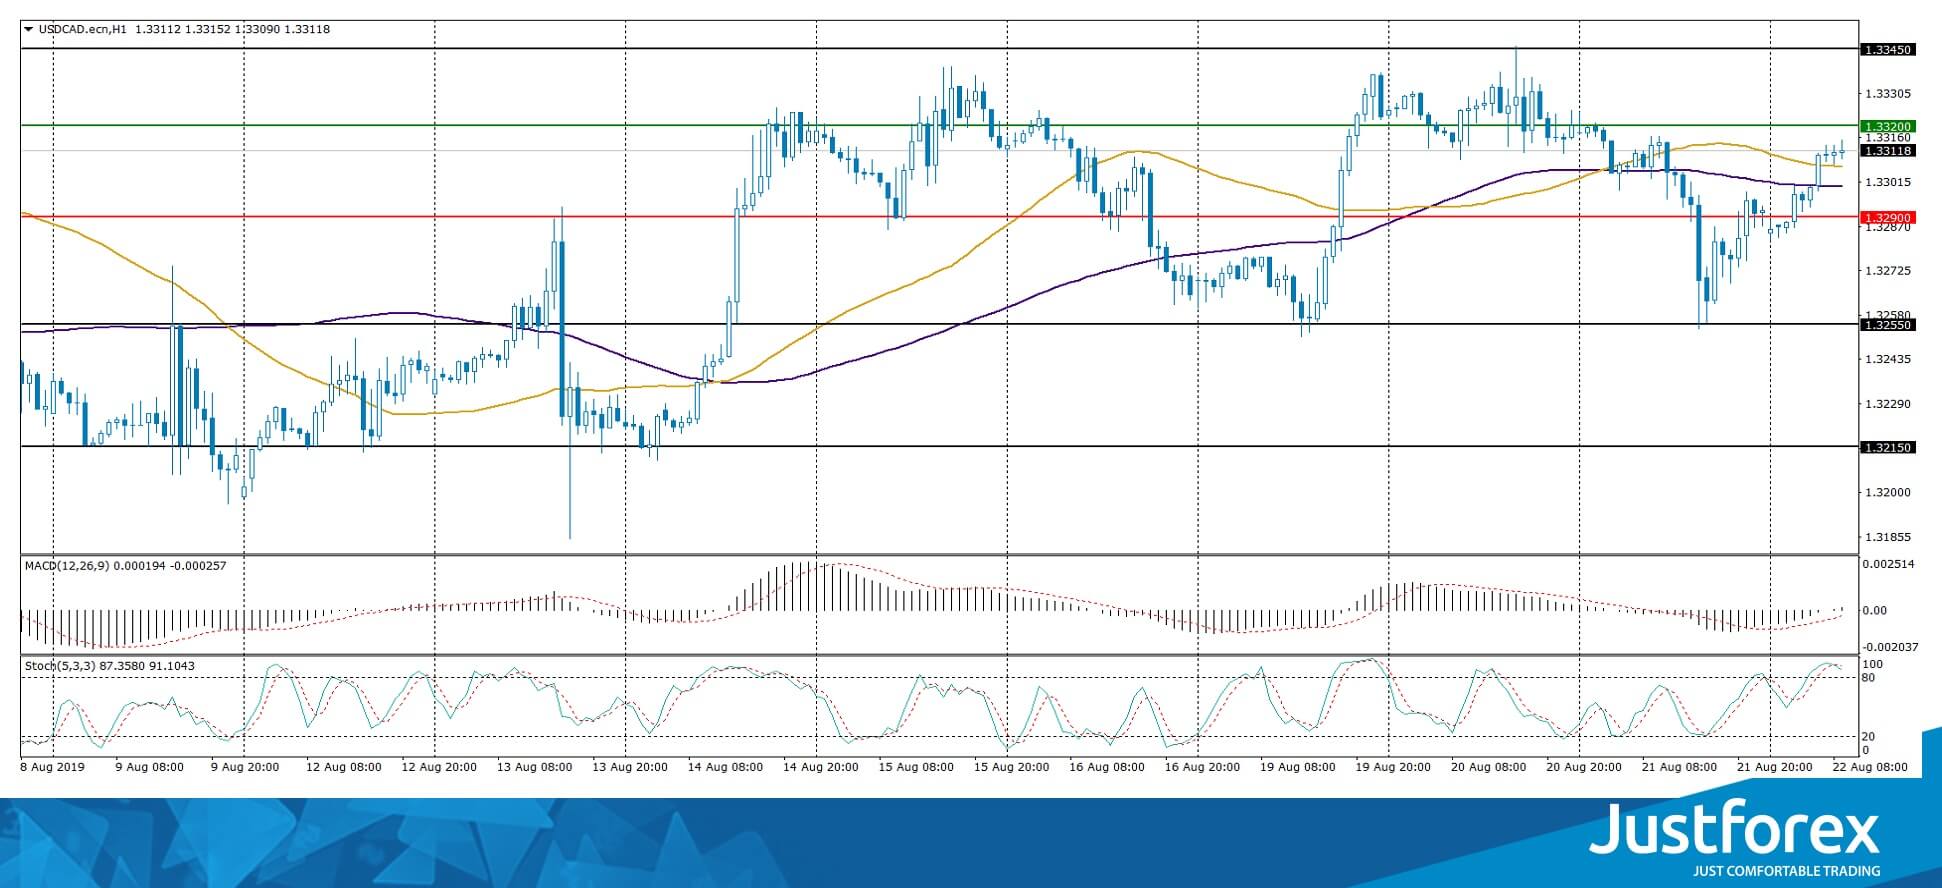
Indicators do not give accurate signals, the price crossed 50 MA and 100 MA.
The MACD histogram is close to 0.
The Stochastic Oscillator is in the overbought zone, the %K line crossed the %D line. There are no signals at this time.
Trading recommendations
Support levels: 1.32900, 1.32550, 1.32150
Resistance levels: 1.33200, 1.33450, 1.33700
If the price consolidates above 1.33200, expect further growth toward 1.33500-1.33700.
Alternatively, the quotes could drop toward 1.32600-1.32400.
The USD/JPY currency pair
Technical indicators of the currency pair:
Prev Open: 106.223
Open: 106.623
% chg. over the last day: +0.35
Day’s range: 106.294 – 106.654
52 wk range: 104.97 – 114.56
The USD/JPY currency pair continues to trade flat. The technical picture is ambiguous. Since the beginning of this week, the following key support and resistance levels have been formed: 106.200 and 106.650, respectively. Investors expect additional drivers. We recommend keeping track of up-to-date information regarding the trade conflict between the USA and China. Positions must be opened from key levels.
The Economic News Feed for 22.08.2019 is calm.
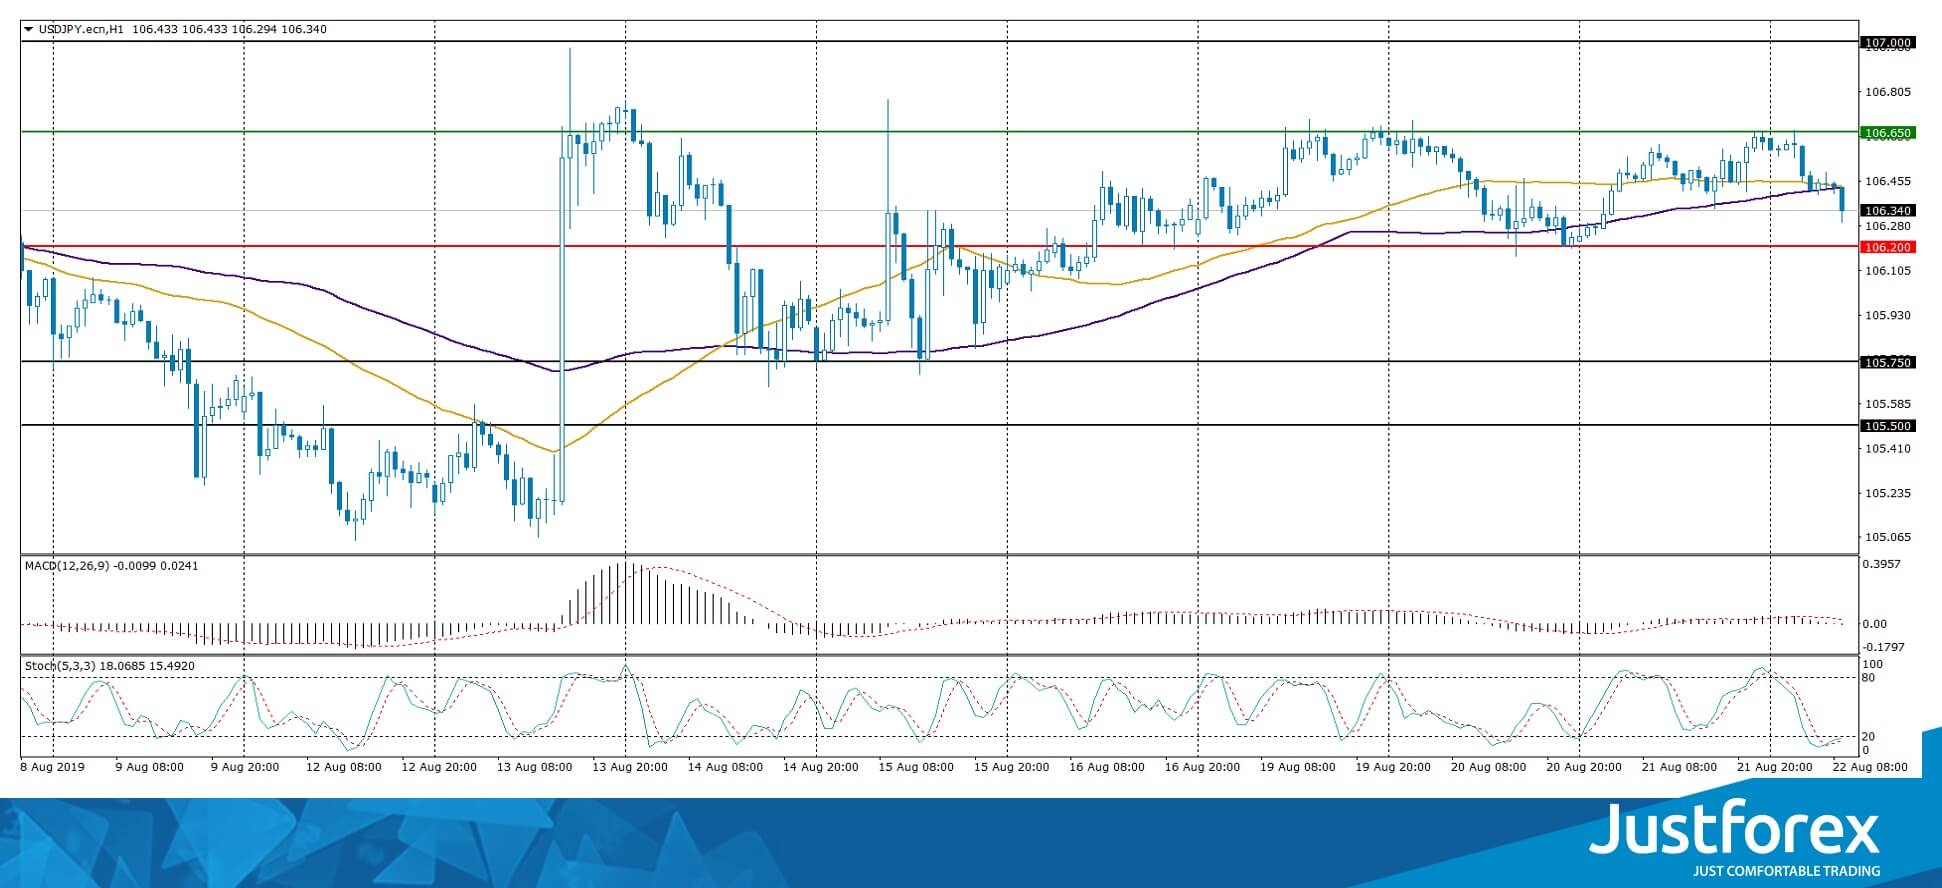
Indicators do not give accurate signals: 50 MA crossed 100 MA.
The MACD histogram is near 0.
The Stochastic Oscillator is in the oversold zone, the %K line crossed the %D line. There are no signals at the moment.
Trading recommendations
Support levels: 106.200, 105.750, 105.500
Resistance levels: 106.650, 107.000
If the price consolidates above 106.650, expect further growth toward 107.000-107.200.
Alternatively, the quotes can drop toward 105.850-105.700.


