
Key Highlights
- Earlier this week, gold price surged to a new 6-year high at $1,555 against the US Dollar.
- The price remains supported near $1,525 and a bullish trend line on the 4-hours chart.
- EUR/USD is struggling below 1.1120 and GBP/USD is holding the key 1.2150 support.
- The US GDP in Q2 2019 is likely to grow 2% (preliminary), less than the last 2.1%.
Gold Price Technical Analysis
Earlier this month, gold price climbed to a new 6-year high at $1,534 against the US Dollar. Later, it corrected lower, but dips remained supported and the price rallied to a new high earlier this week.
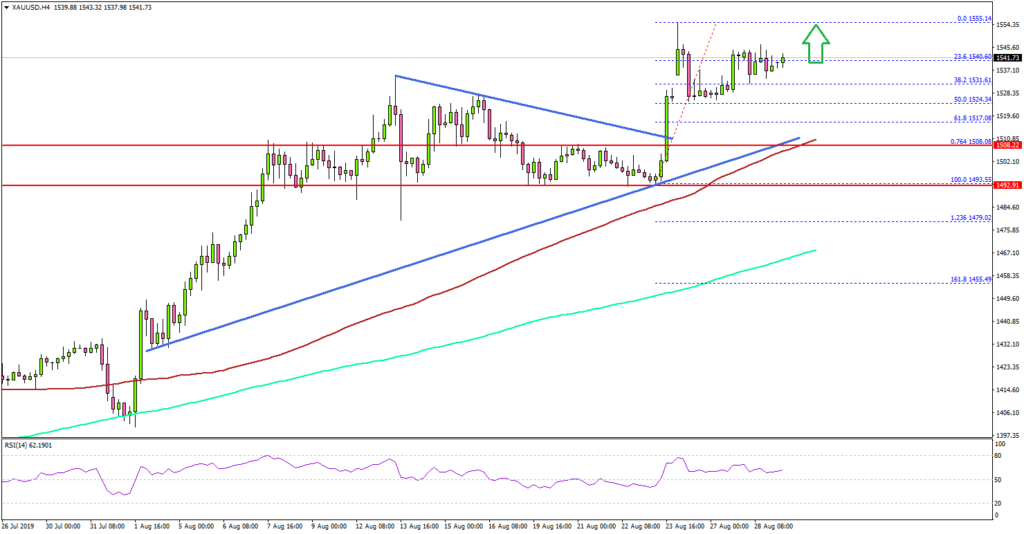
The 4-hours chart of XAU/USD indicates that the price remained well bid near the $1,500 level and the 100 simple moving average (4-hours, red) (as discussed in the last analysis).
As a result, there was a fresh increase above $1,525 and the last swing high at $1,534. The price traded to a new 6-year high at $1,555 and recently corrected lower. It traded below the $1,540 and $1,535 support levels.
However, the 50% Fib retracement level of the upward move from the $1,493 low to $1,555 high acted as a strong support. The price is now trading with a positive angle and it seems like it could revisit the $1,550 and $1,555 levels.
If there are more upsides, the bulls could target the $1,560 resistance area. Conversely, there are many supports on the downside near the $1,525 and $1,510 levels. Moreover, the 61.8% Fib retracement level of the upward move from the $1,493 low to $1,555 high is at $1,517.
The main support is now near $1,505, the 100 simple moving average (4-hours, red), and a connecting bullish trend line on the same chart.
Therefore, gold price remains well supported above $1,500 and it could continue to grind higher. Only a successful daily close below $1,500, followed by a break below the $1,493 low could start a major downside correction.
Overall, gold price is likely to continue higher towards $1,560 or even $1,572 as long as it is following the 100 SMA. Looking at EUR/USD, the pair is struggling to correct above the 1.1120 and 1.1125 resistance levels. GBP/USD also corrected lower recently, but it managed to stay above the key 1.2150 support.
Economic Releases to Watch Today
- Germany’s Unemployment Change for August 2019 – Forecast 4K, versus 1K previous.
- Germany’s Unemployment Rate for August 2019 – Forecast 5.0%, versus 5.0% previous.
- German CPI for August 2019 (YoY) (Preliminary) – Forecast +1.5%, versus +1.7% previous.
- German CPI for August 2019 (MoM) (Preliminary) – Forecast -0.1%, versus +0.5% previous.
- US Initial Jobless Claims – Forecast 215K, versus 209K previous.
- US Gross Domestic Product Q2 2019 (Preliminary) – Forecast 2.0% versus previous 2.1%.


