On August 1, the HKD/JPY currency pair reversed south from the upper boundary of the falling wedge pattern at 13.96. The rate has been testing the lower wedge line at 13.40 since the middle of August.
From a theoretical point of view, it is likely that the exchange rate could trade upwards, as it should target the upper pattern line. However, note, that the rate has to surpass the resistance level formed by the monthly S2 at the 13.62 mark.
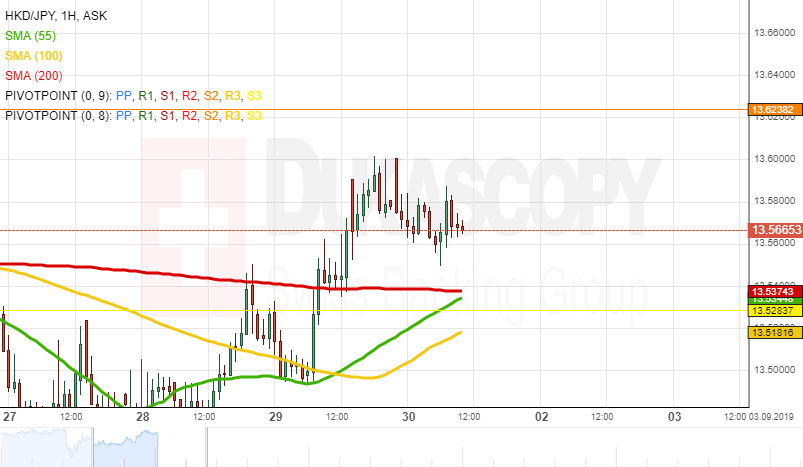
If the given resistance level holds, it is likely that the pair could reverse south to re-test the lower pattern boundary. Also, note that the Hong Kong Dollar is pressured by the 55-, 100– and 200-period SMAs (4H time-frame chart), located in the 13.53/13.67 range. Thus, if the given wedge does not hold, it is likely that the rate could continue to decline. A possible downside target is the psychological level at 13.00.