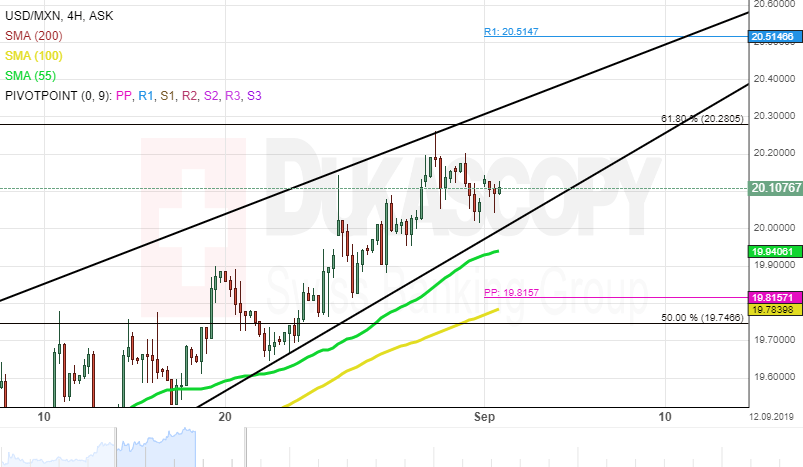
The US Dollar has been appreciating against the Mexican Peso within the rising wedge pattern since the beginning of August. Currently, the USD/MXN currency pair is trading at the 20.15 level.
From a theoretical point of view, it is likely that a breakout south from the given pattern could occur within the following trading sessions. In this case, the exchange rate could drop to the support level—the monthly R1, located at 19.40.
However, note, that the pair is supported by the 55-, 100– and 200-hour moving averages, currently located in the 19.46/19.90 range. Thus, the Greenback could maintain its appreciation against the Mexican Peso in the nearest future. Note that the rate has to surpass the resistance level formed by the Fibonacci 61.80% retracement at 20.28.