
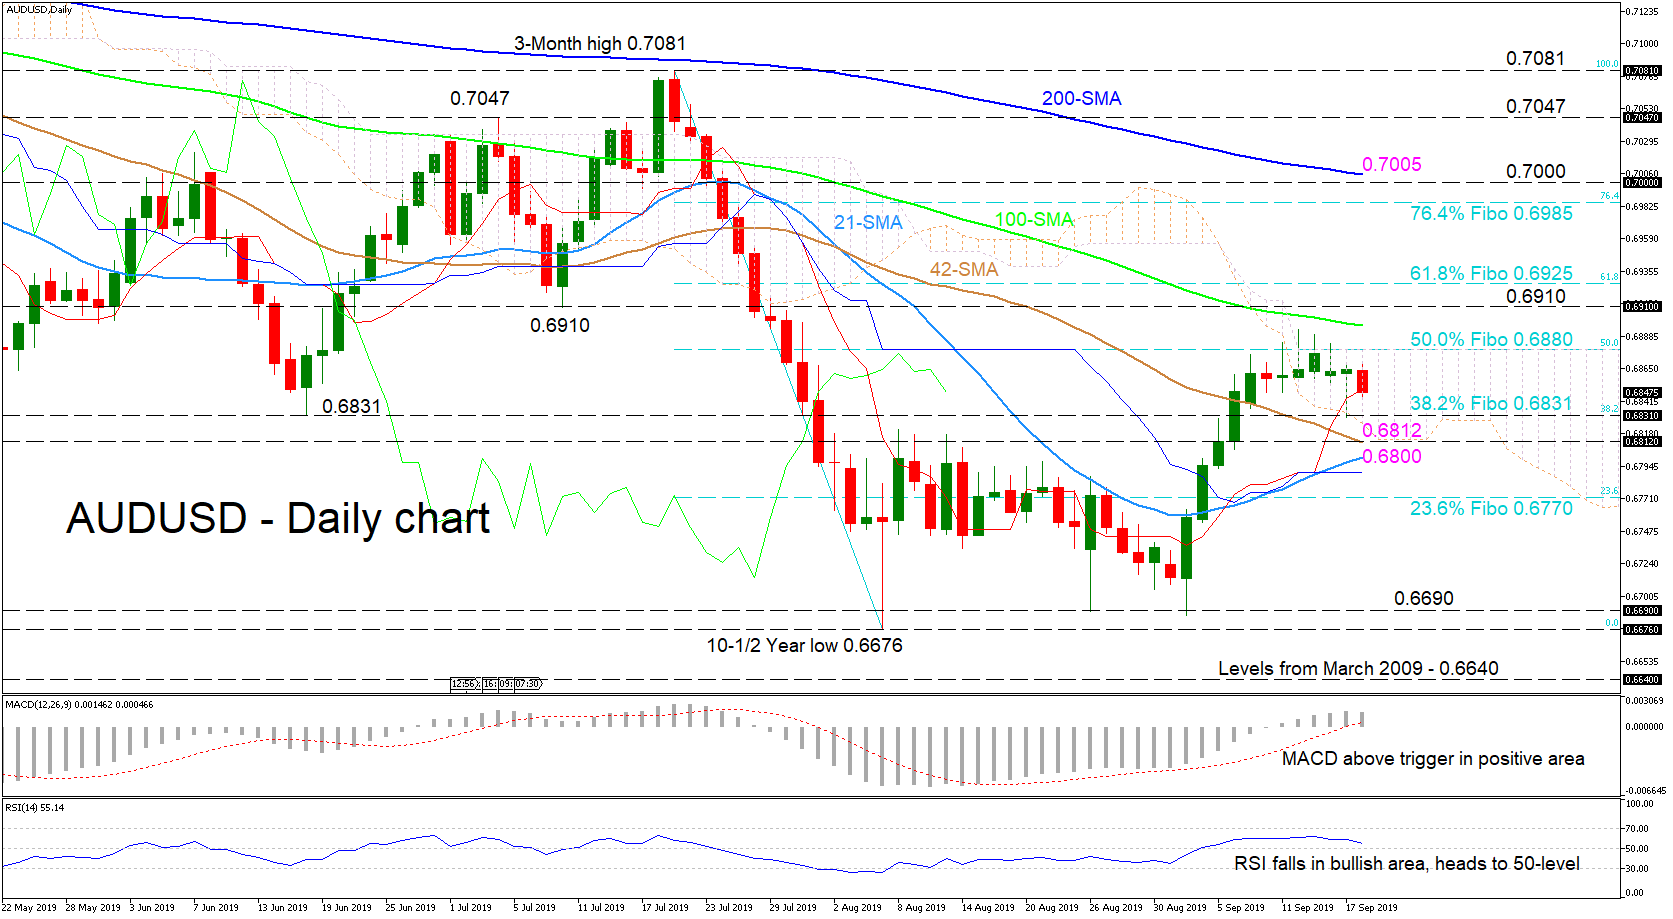
AUDUSD shifted sideways into the Ichimoku cloud after its attempt to recoup the losses that commenced on July 19 was halted at the ceiling of 0.6880 – the 50.0% Fibonacci retracement level of the down leg from 0.7081 to 0.6676.
The 21-day simple moving average (SMA) seems to be approaching a bullish cross, while the Tenkan-sen line has inclined sharply above the Kijun-sen one, both suggesting some positive strength. However, the MACD and the RSI reflect decreasing positive momentum, as the MACD above its trigger, is falling in the positive zone, while the RSI is declining in the bullish territory. Backing the bigger negative picture are the downward sloping 42-, 100- and 200-day SMAs and the flat Kijun-sen line.
If the bulls manage to fracture the upper boundary of the Ichimoku cloud and the 50.0% Fibo at 0.6880, resistance could then come from the 100-day SMA before the 0.6910 level. Higher, the nearby 61.8% Fibo of 0.6925 could apply some pressure, with buying orders revived, thrusting the pair to test the 76.4% Fibo of 0.6985.
Moving beneath the 38.2% Fibo of 0.6831, the more important support region of 0.6812 – 0.6800 could come under focus, as that is where the lower boundary of the cloud and the 21- and 42-day SMAs are presently located. Even lower, support comes at the 23.6% Fibo of 0.6770, before light can shine on the multi-year lows.
Overall, a break above 0.6880 or below 0.6831 would reveal the short-term directional bias.


