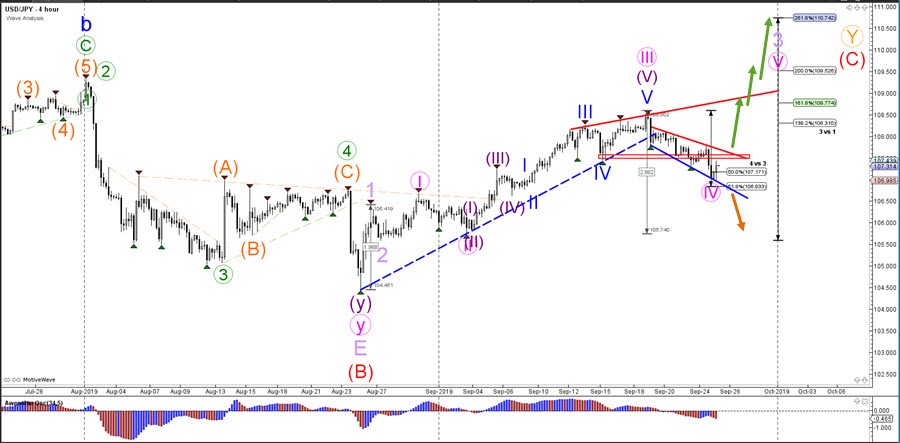
The USD/JPY is testing the 50-61.% Fibonacci levels of wave 4 vs 3 (pink). A break above the resistance zone (red) could indicate a bullish breakout towards the Fibonacci targets of wave 3 vs 1 whereas a bearish breakout below the 61.8% Fibonacci makes the wave 4 (blue) pattern unlikely.
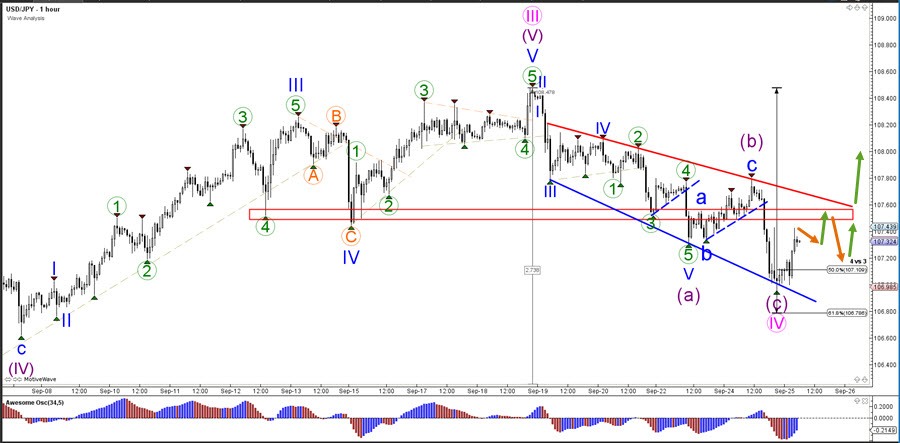
The USD/JPY seems to have completed a bearish ABC (purple) pattern at the recent low. It also made a strong bullish bounce at the 50% Fibonacci level of wave 4 (pink), which could indicate a potential start of the wave 5. The price however will need to break above the resistance zone first.