
The EUR/USD currency pair
Technical indicators of the currency pair:
Prev Open: 1.09930
Open: 1.10226
% chg. over the last day: +0.19
Day’s range: 1.09941 – 1.10226
52 wk range: 1.0931 – 1.1817
The EUR/USD currency pair has stabilized. Unidirectional trends are not observed. Greenback demand weakened after the release of weak data on consumer confidence in the United States. At the moment, EUR/USD quotes are testing local support and resistance levels 1.09900 and 1.10250. Financial markets participants expect additional drivers. We recommend that you keep track of up-to-date information regarding trade negotiations between Washington and Beijing. Positions must be opened from key levels. Also, keep an eye on the FOMC representatives.
At 17:00 (GMT+3:00) the US will publish a report on the primary real estate sales.
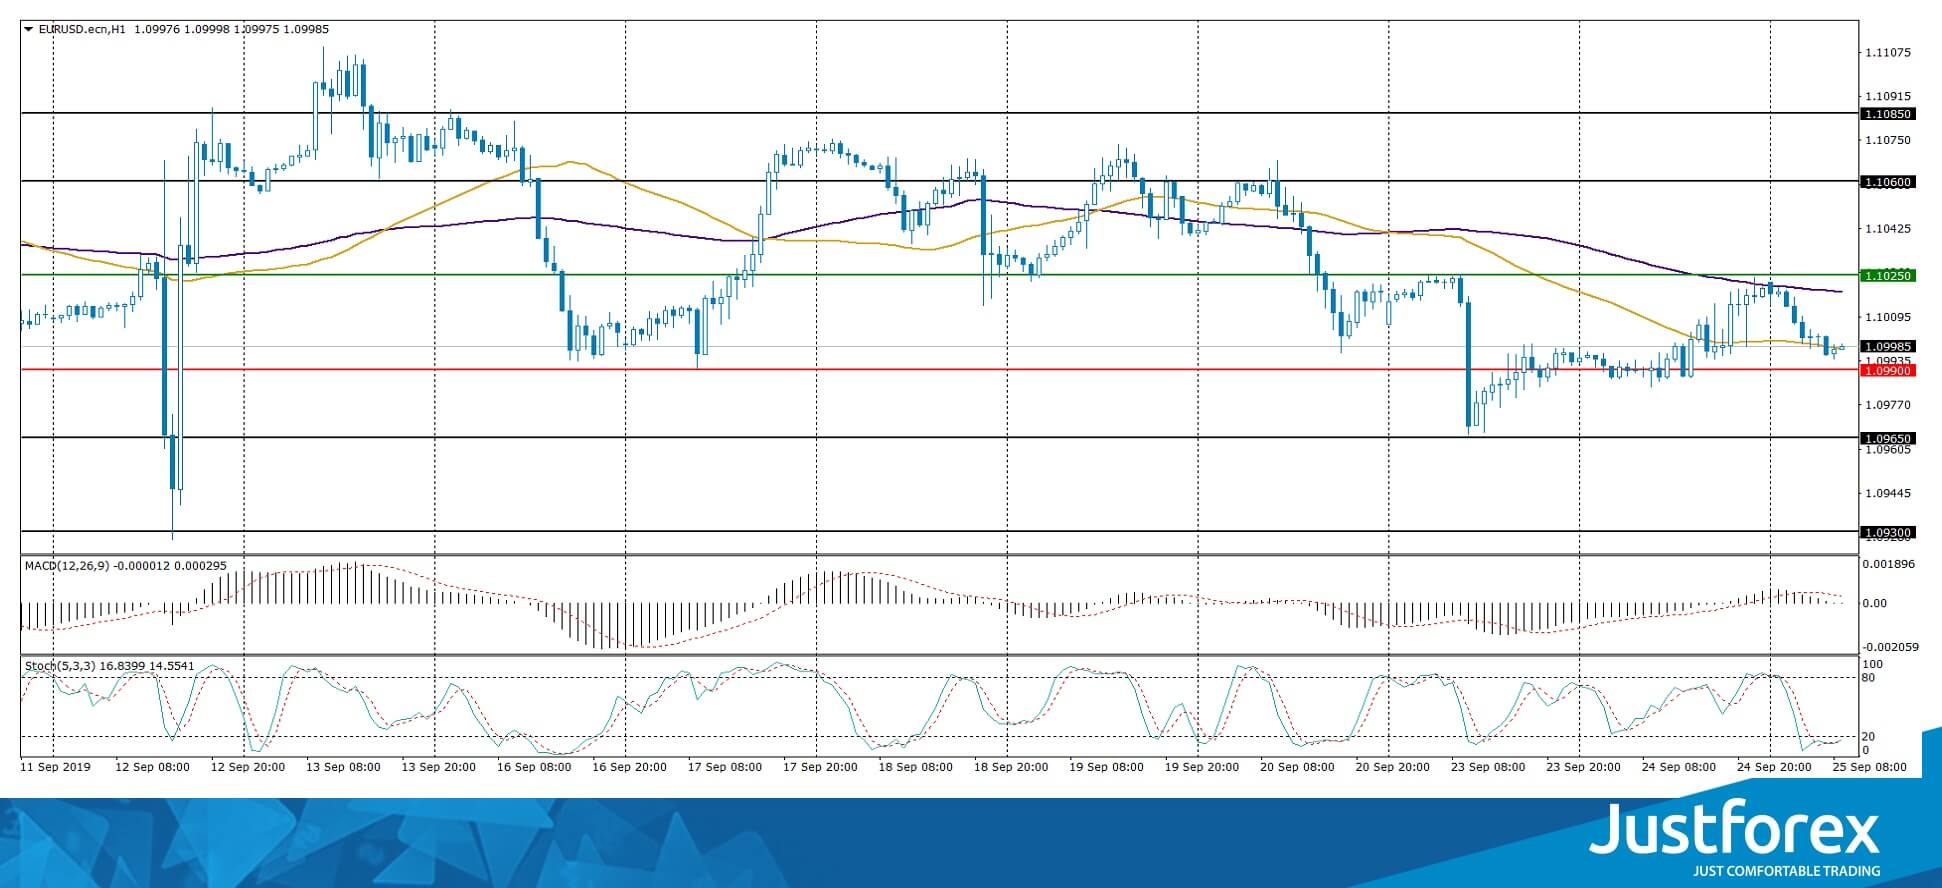
Indicators do not give accurate signals: the price crossed 50 MA and 100 MA.
The MACD histogram is located near the 0 mark.
The Stochastic Oscillator is in the oversold zone, the %K line crossed the %D line. There are no signals at the moment.
Trading recommendations
Support levels: 1.09900, 1.09650, 1.09300
Resistance levels: 1.10250, 1.10600, 1.10850
If the price consolidates below 1.09900, expect the quotes to fall toward 1.09600-1.09400.
Alternatively, the quotes can grow toward 1.10500-1.10700.
The GBP/USD currency pair
Technical indicators of the currency pair:
Prev Open: 1.24328
Open: 1.24909
% chg. over the last day: +0.44
Day’s range: 1.24610 – 1.24977
52 wk range: 1.1995 – 1.3385
Yesterday, bullish mood prevailed on the GBP/USD currency pair. Demand for the pound rose after reports that the UK Supreme Court ruled that Boris Johnson’s decision to suspend parliament was illegal. This allows parliamentarians more time to avoid the hard Brexit scenario. At the moment, the key support and resistance levels are 1.24550 and 1.25000, respectively. We recommend opening positions from key levels.
The Economic News Feed for 25.09.2019 is calm.
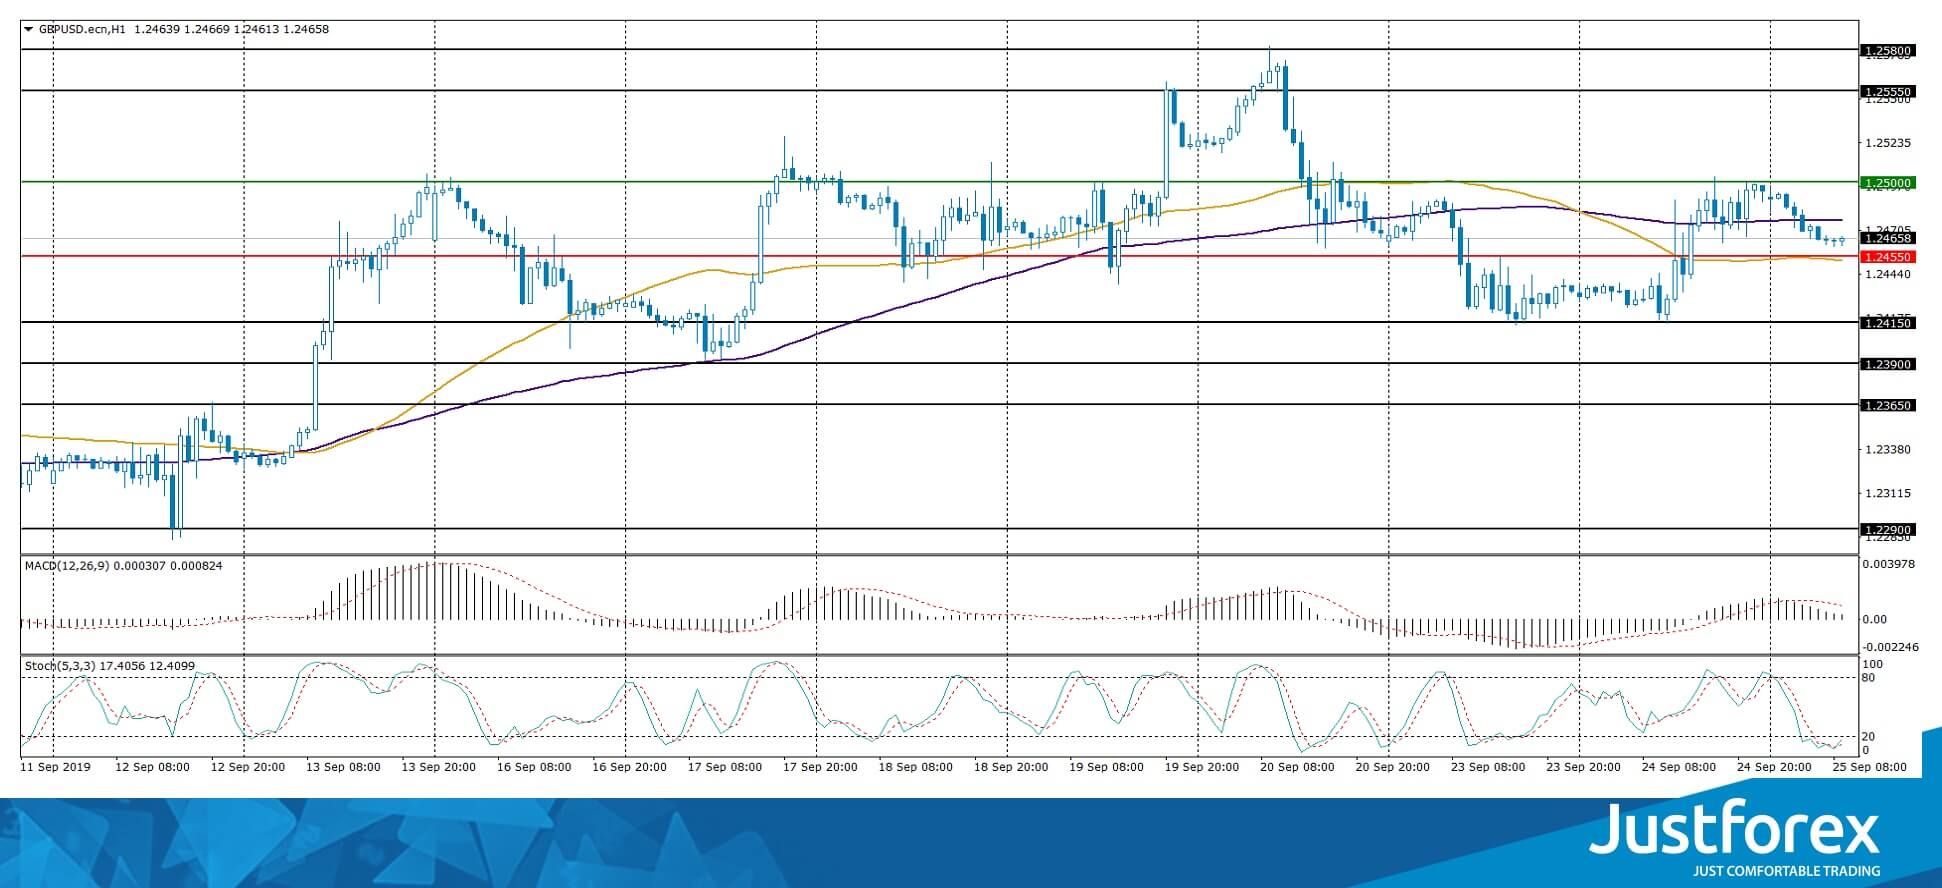
Indicators do not give accurate signals: the price crossed 50 MA and 100 MA.
The MACD histogram is in the positive zone, but below the signal line, which gives a weak signal to buy GBP/USD.
The Stochastic Oscillator is in the oversold zone, the %K line crossed the %D line. There are no signals at the moment.
Trading recommendations
Support levels: 1.24550, 1.24150, 1.23900
Resistance levels: 1.25000, 1.25550, 1.25800
If the price consolidates below 1.24550, GBP/USD is expected to fall toward 1.24000.
Alternatively, the quotes could grow toward 1.25300-1.25500.
The USD/CAD currency pair
Technical indicators of the currency pair:
Prev Open: 1.32567
Open: 1.32405
% chg. over the last day: -0.18
Day’s range: 1.32352 – 1.32653
52 wk range: 1.2727 – 1.3664
The technical picture on the USD/CAD currency pair is still ambiguous. Looney continues to bargain in flat. At the moment, the following key support and resistance levels can be distinguished: 1.32350 and 1.32650, respectively. USD / CAD quotes have the potential to decline. Today, participants in financial markets will evaluate statistics on the real estate market in the United States. We also recommend paying attention to the dynamics of oil quotes. Positions must be opened from key levels.
The Economic News Feed for 25.09.2019 is calm.
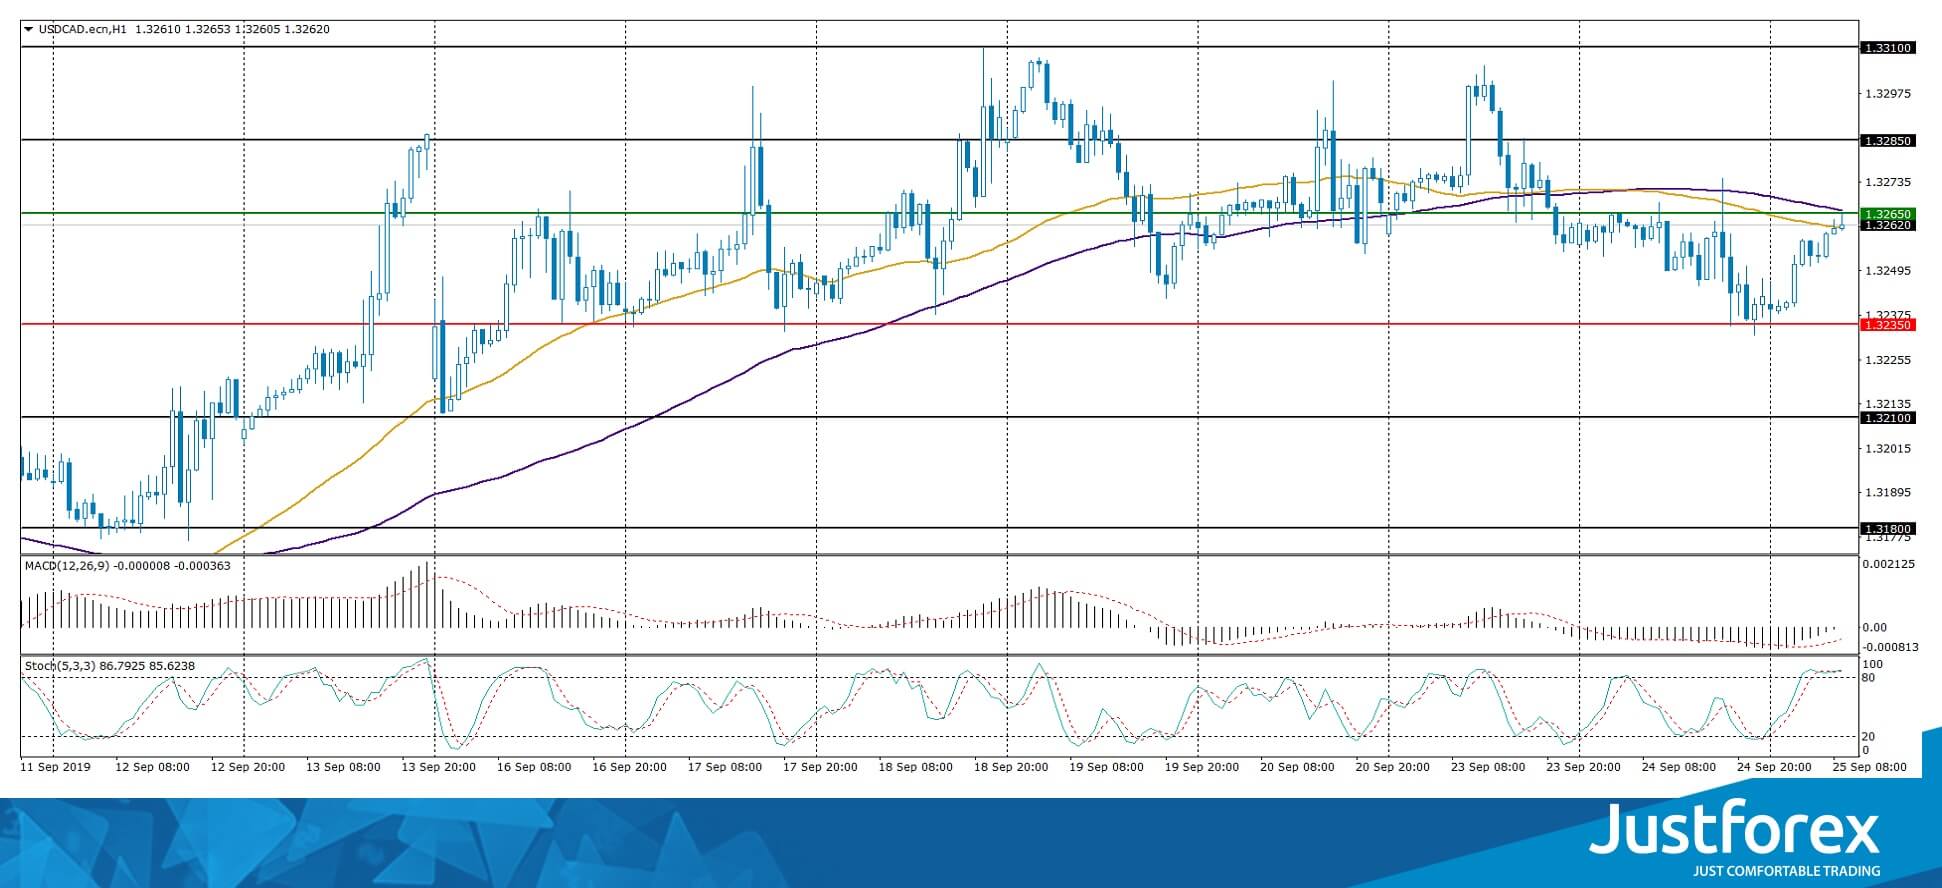
Indicators do not give accurate signals: the price crossed 50 MA and 100 MA.
The MACD histogram is located near 0. There are no signals at the moment.
The Stochastic Oscillator is in the overbought zone, the %K line crossed the %D line. There are no signals at the moment.
Trading recommendations
Support levels: 1.32350, 1.32100, 1.31800
Resistance levels: 1.32650, 1.32850, 1.33100
If the price consolidates below 1.32350, USD/CAD is expected to fall. The quotes will move toward 1.32000-1.31800.
Alternatively, the quotes can grow toward 1.33000.
The USD/JPY currency pair
Technical indicators of the currency pair:
Prev Open: 107.540
Open: 107.046
% chg. over the last day: -0.37
Day’s range: 106.982 – 107.424
52 wk range: 104.97 – 114.56
USD/JPY remains in a bearish mood. The trading instrument set the new local minimums. The quotes found support and the new level of 107.000. 107.400 acts as a mirror resistance. The safe haven currency can grow against USD. Keep tracking relevant info about the US/China negotiations. Open positions from the key levels.
The Economic News Feed for 25.09.2019:
Economic Event (JPY) – 00:00 (GMT+3:00);
Economic Event (JPY) – 00:00 (GMT+3:00);
Economic Event (JPY) – 00:00 (GMT+3:00);
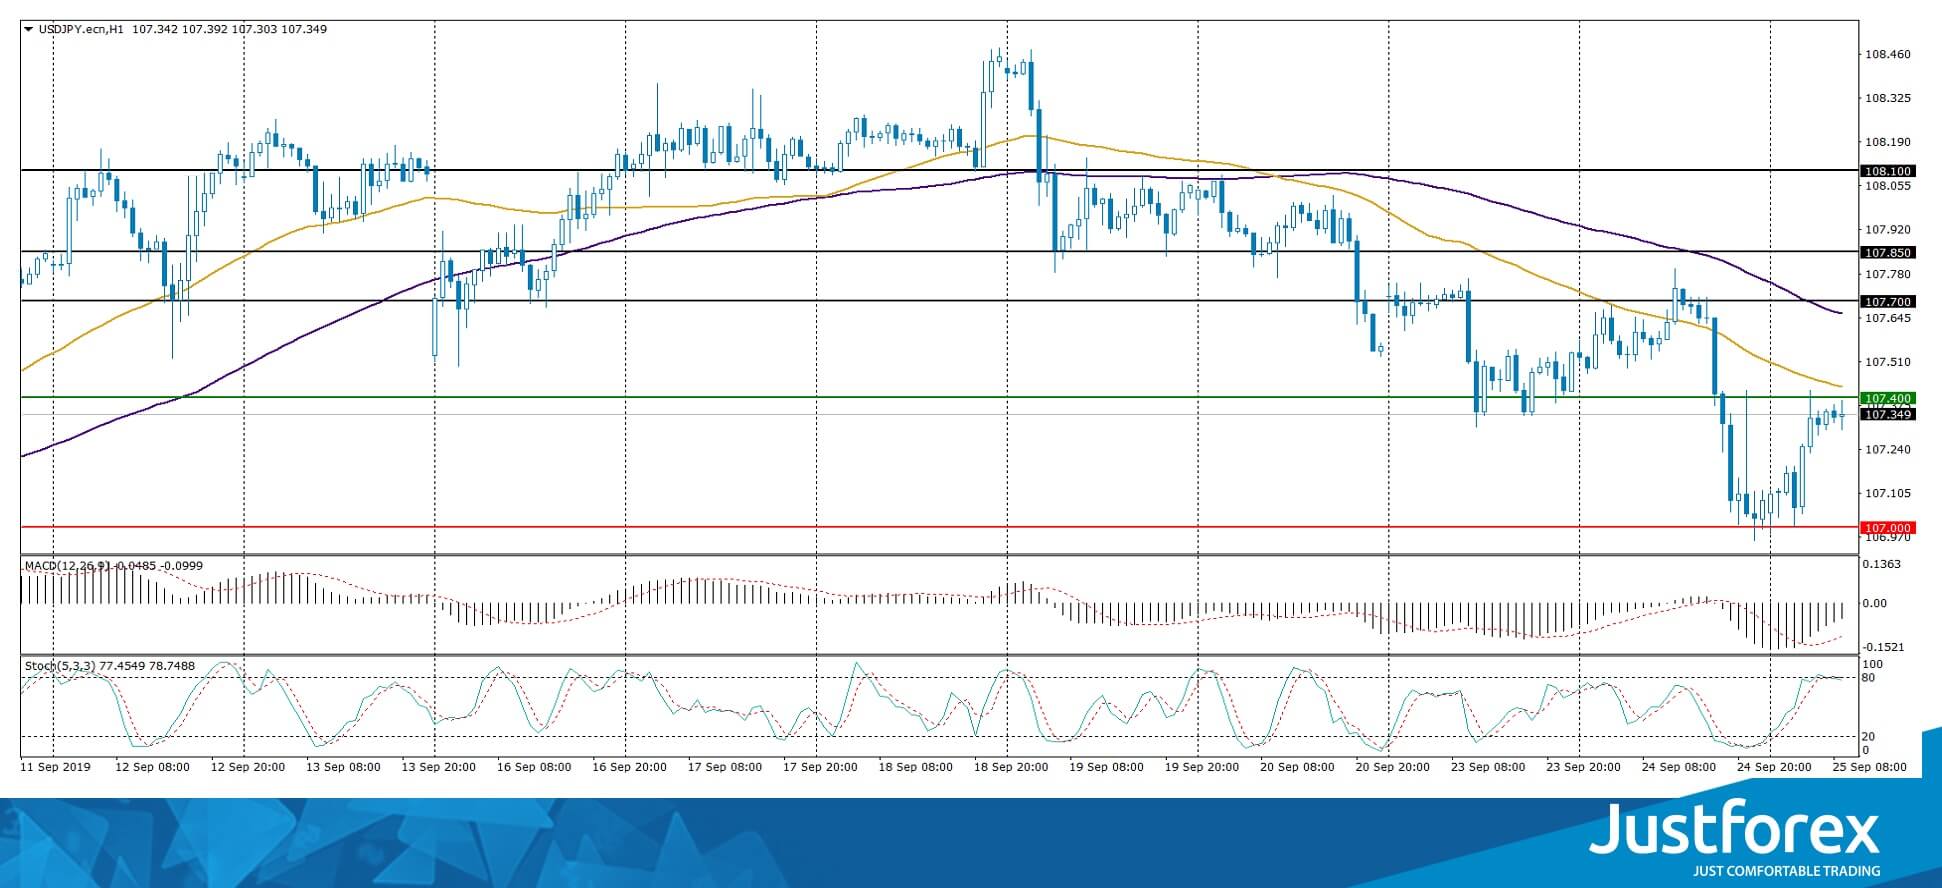
The indicators point toward the power of the sellers: the price fixed below 50 MA and 100 MA.
The MACD histogram is in the negative zone but above the signal line which gives a weak signal to sell USD/JPY.
The Stochastic Oscillator is near the overbought zone, the %K line has crossed the %D line. There are no signals at the moment.
Trading recommendations
Support levels: 107.000, 106.700
Resistance levels: 107.400, 107.700, 107.850
If the price fixes below 107.000, expect further descend towards 106.700-106.500.
Alternatively, the quotes can grow toward 107.700-107.850.


