
Oil prices are still attracting a lot of attention due to their increased volatility.
According to heads of several major global oil and gas companies, the oil will cost about 50 USD per barrel in October 2020. This opinion was voiced at the Oil & Money conference that took place last week. The key risks for the oil are US-China trade wars, an increase in oil extraction and production in the USA, and a slowdown in the global economic growth rate. In other words, the same as right now, meaning that these risks can be considered long-term. This, in its turn, means that they are significantly underestimated and can pull oil prices down at any moment.
The report from Baker Hughes published last Friday showed that the number of rigs in the USA rose for the first time in eight weeks. The total number added 1 unit and is now equal to 856. This being said, the number of oil rigs added 2 units, while gas rigs lost 1.
On Monday morning, October 14th, Brent is trading at 60.22 USD and this price still includes the events that happened the week before – oil prices jumped after reports of Iranian tanker explosion not far from the Red Sea coast of Saudi Arabia.
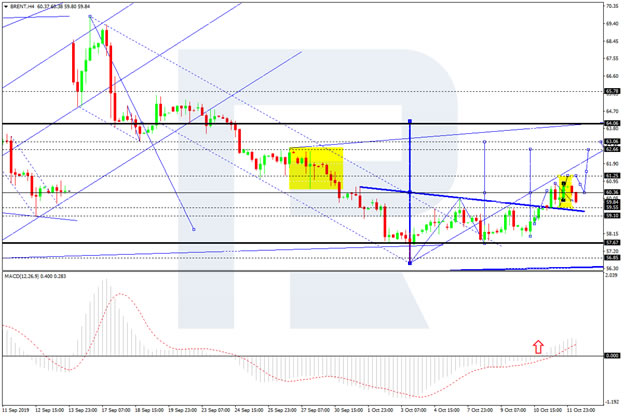
In the H4 chart, we can see some signs of “Head & Shoulders” reversal pattern. After breaking the top of the first wave at 60.05, Brent is consolidating around 60.35. This structure may be considered as an upside continuation pattern; the entire ascending structure may be considered as the third wave to the upside. After reaching the target, the instrument may start a new correction towards 60.40 and then resume trading inside the uptrend with the first target at 64.10. From the technical point of view, this scenario is confirmed by MACD Oscillator: its signal line is moving above 0. As long as the Oscillator is staying above 0, the uptrend will dominate.
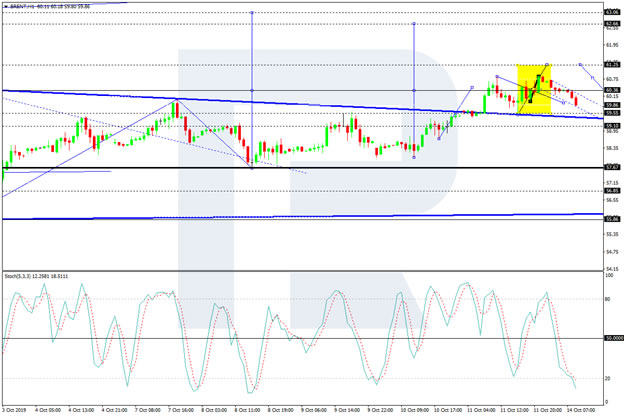
As we can see in the H1 chart, Brent is moving inside a narrow consolidation range around 60.35. Possibly, today the pair may expand the range towards 61.25 and then return to 60.35. After that, the instrument may grow to break 61.25 and then continue trading upwards to reach 62.66. From the technical point of view, this scenario is confirmed by Stochastic Oscillator: its signal line is about to reverse while moving inside the “oversold area”. Practically, the Oscillator tells that the price is trading near the downside border of the consolidation range. The indicator is expected to grow towards 50. Breakout of this level will boost the uptrend.


