
A note on lower timeframe confirming price action…
Waiting for lower timeframe confirmation is our main tool to confirm strength within higher timeframe zones, and has really been the key to our trading success. It takes a little time to understand the subtle nuances, however, as each trade is never the same, but once you master the rhythm so to speak, you will be saved from countless unnecessary losing trades. The following is a list of what we look for:
- A break/retest of supply or demand dependent on which way you’re trading.
- A trendline break/retest.
- Buying/selling tails … essentially we look for a cluster of very obvious spikes off of lower timeframe support and resistance levels within the higher timeframe zone.
- Candlestick patterns. We tend to only stick with pin bars and engulfing bars as these have proven to be the most effective.
We typically search for lower-timeframe confirmation between the M15 and H1 timeframes, since most of our higher-timeframe areas begin with the H4. Stops are usually placed 1-3 pips beyond confirming structures.
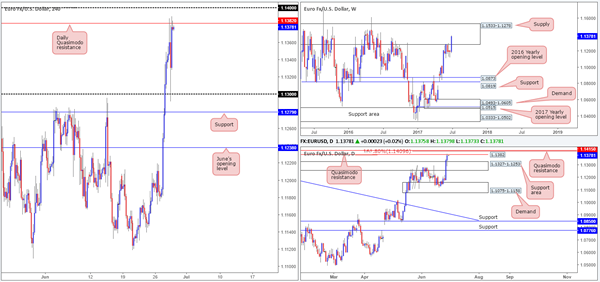
EUR/USD
In recent trading, the single currency gravitated north and found resistance around the daily Quasimodo formation pegged at 1.1382. This was a noted level to look for shorts due to this barrier being positioned within the walls of a weekly supply at 1.1533-1.1278. In addition to this, we liked the fact that the Quasimodo was (and still is) located just below a daily AB=CD 161.8% ext. at 1.1409 and the psychological band 1.14. Well done to any of our readers who managed to pin down a short from here. The move from 1.1382 provided at least 80 pips of profit and considering the stop-loss order should have been positioned at 1.1415 (33 pips), this would have been a worthwhile trade.
Moving forward, we can see that the unit is now back within striking distance of the aforementioned daily Quasimodo resistance. Selling from here again, of course, is a possibility, but not something we would advise. The main reason being is that the daily support area at 1.1327-1.1253 was tested yesterday and the sell orders from 1.1382 may be weak.
Our suggestions: The next area of interest for the desk is the daily Quasimodo resistance seen planted a little higher on the curve at 1.1415. Again, we know that this level is fresh, is positioned just above the daily AB=CD 161.8% ext. at 1.1409 and the psychological band 1.14, as well as still being located within the current weekly supply. To that end, we feel a bounce, at the very least, will be seen from 1.1415. Stops can be placed above the Quasimodo pattern’s apex at around 1.1430, and the first take-profit target will be the 1.1382 region: the previous daily Quasimodo pattern.
Data points to consider: German Prelim CPI. US Final GDP q/q figures, as well as the US weekly unemployment claims at 1.30pm GMT+1.
Levels to watch/live orders:
- Buys: Flat (stop loss: N/A).
- Sells: 1.1415 (stop loss: 1.1430).
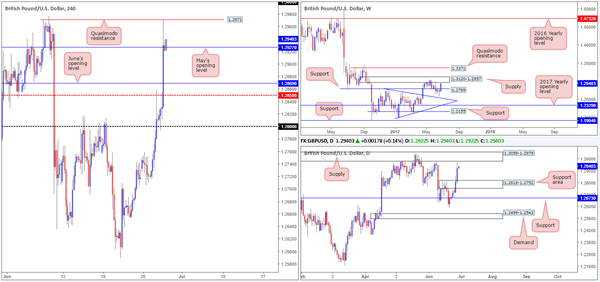
GBP/USD
In response to Mark Carney’s comments regarding monetary stimulus, the GBP/USD aggressively rose north. The H4 mid-level resistance at 1.2850 and June’s opening level at 1.2869 were consumed, which, as you can see, left price free to violently whipsaw through May’s opening level at 1.2927.
With H4 bulls looking strong just a few pips above May’s opening level right now, is this a good time to be thinking about buying this market? Let’s take a peek at what the higher timeframes are up to…
Weekly price recently shook hands with supply formed at 1.3120-1.2957. This area has already proven that it has some grit given that it held the unit lower in May. By the same token, daily action came within a cat’s whisker of clipping the underside of supply seen at 1.3058-1.2979. Considering that this area is positioned within the walls of the aforementioned weekly zone, this area is just as significant, in our opinion.
Our suggestions: Entering long therefore, despite H4 bulls demonstrating strength at the moment, is not something we would recommend. Instead, what we’re looking for is H4 price to retest the Quasimodo resistance at 1.2971 and hold firm. Should the reaction manage to produce a bearish candle, preferably a full-bodied candle, our team would consider selling, with an overall take-profit target being set around the top edge of the daily support area at 1.2818.
Data points to consider: US Final GDP q/q figures, as well as the US weekly unemployment claims at 1.30pm GMT+1.
Levels to watch/live orders:
- Buys: Flat (stop loss: N/A).
- Sells: 1.2971 region ([waiting for a reasonably sized H4 bear candle to form – preferably a full-bodied candle – following the retest is advised] stop loss: ideally beyond the candle’s wick).
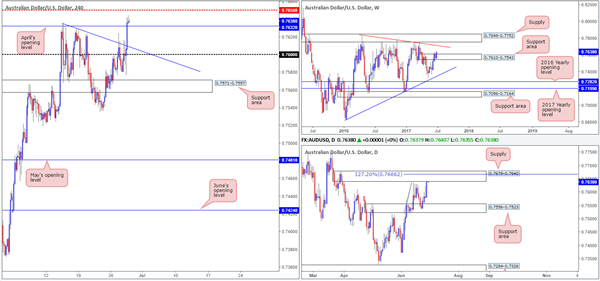
AUD/USD
Beginning from the top this morning, the weekly chart shows supply at 0.7610-0.7543, at least in our view, is now well and truly consumed. The next area of interest on this scale can be seen around the trendline resistance extended from the high 0.7835.
Despite the somewhat bullish tone being seen on the weekly chart at the moment, daily price is currently teasing the underside of a supply area coming in at 0.7679-0.7640. This area also happens to hold an AB=CD 127.2% ext. at 0.7666.
Looking over to the H4 chart, we can see that price is now hovering above April’s opening level coming in at 0.7632, and also just ahead of the H4 mid-level resistance barrier drawn from 0.7650. A few pips above this level is a H4 Quasimodo formation (not seen on the chart) seen at 0.7676.
Our suggestions: Buying this market, despite what the weekly timeframe is telling us, is not something we’d label as high probability right now given the current daily supply and nearby aforementioned H4 structures. Along similar lines, selling would also be a tad risky with the weekly support area seen in play at the moment. However, we do feel that should price connect with the H4 Quasimodo level at 0.7676, given that it is positioned within daily supply and nearby the daily 127.2% level, a bounce from here is highly likely. Ultimately though, you will want to get in here with a relatively tight stop here seeing as 0.7650 could halt selling and promote buying.
For us personally, we’re going to remain flat for now and watch how price action behaves during today’s segment before making any further judgment.
Data points to consider: US Final GDP q/q figures, as well as the US weekly unemployment claims at 1.30pm GMT+1.
Levels to watch/live orders:
- Buys: Flat (stop loss: N/A).
- Sells: Possible bounce from 0.7676.
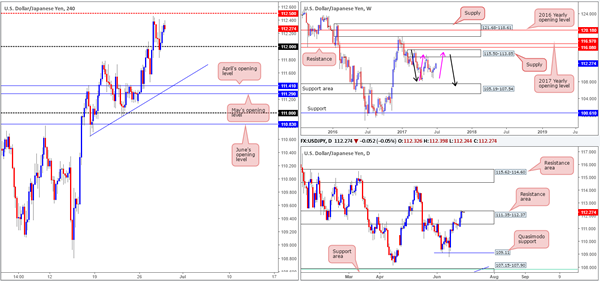
USD/JPY
Daily buyers remain keen in this market, despite price trading within the upper edge of a daily resistance area pegged at 111.35-112.37. In addition to this, weekly price shows room to advance up to supply pegged at 115.50-113.85, in the shape of a weekly AB=CD correction (see pink arrows).
However, buying right now, when H4 price is seen loitering beneath a mid-level resistance barrier at 112.50, is not something we would encourage. A break above 112.50, nevertheless, could inspire buyers to enter the market and bring price up to the 113 handle, and possibly the H4 resistance seen at 113.64.
Our suggestions: To prove buyer intent, a H4 close above 112.50 is needed. This – coupled with a retest and a lower-timeframe confirming signal (see the top of this report) would, in our book of technical setups, be enough to validate a long, targeting 113 as an initial take-profit zone.
Data points to consider: US Final GDP q/q figures, as well as the US weekly unemployment claims at 1.30pm GMT+1.
Levels to watch/live orders:
- Buys: Watch for H4 price to engulf 112.50 and then look to trade any retest seen thereafter ([waiting for a lower-timeframe buy signal to form following the retest is advised] stop loss: dependent on where one confirms this level).
- Sells: Flat (stop loss: N/A).
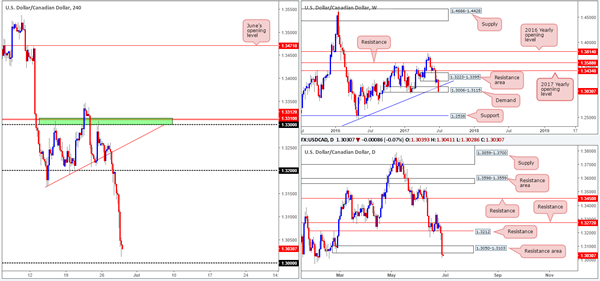
USD/CAD
For those who read Wednesday’s report you may recall our desk mentioning that a short position was taken from 1.3171, with a stop positioned at 1.3205. As you can see, the trade worked out beautifully and exceeded our expectations, given we took profit around the top edge of the weekly demand at 1.3115. Our reasoning behind this call was due to the space seen for price to move lower on the bigger picture, and also the fact that H4 price retested the underside of 1.32 and printed a reasonably sized full-bodied bearish candle.
Going forward, the pair is now seen within shouting distance of a large psychological band at 1.30. This level has held price higher on several occasions, with the most recent being seen in late January. While we agree that this level does hold promise, the bigger picture shows a nearby resistance area at 1.3050-1.3103.
Also of particular interest is that 1.30 is positioned just beneath weekly demand at 1.3006-1.3115. Therefore, stops from below this weekly zone could provide enough liquidity for the big boys to buy from 1.30 today.
Our suggestions: Personally, we really like 1.30 as a potential buy zone, if not only for the fact that it has held so beautifully in the past. However, that does not mean we would consider placing a pending buy order here! Waiting for the H4 candles to react and show buyer intent is, we believe, the safer route to take before pulling the trigger.
Data points to consider: US Final GDP q/q figures, as well as the US weekly unemployment claims at 1.30pm GMT+1.
Levels to watch/live orders:
- Buys: 1.30 region ([waiting for a reasonably sized H4 bull candle to form – preferably a full-bodied candle – following the retest is advised] stop loss: ideally beyond the candle’s tail).
- Sells: Flat (Stop loss: N/A).
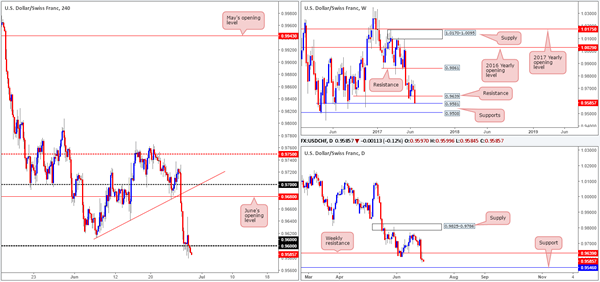
USD/CHF
The picture being painted on the USD/CHF is an interesting one. Weekly price is, as we write, challenging the support level pegged at 0.9581. Down on the daily timeframe, we can see that yesterday’s candle retested the underside of a weekly resistance at 0.9639 and formed a rather conspicuous selling wick. The next downside target on this scale does not come into view until we reach 0.9546.
Swinging over to the H4 timeframe, the bulls are struggling to register any noteworthy movement around the 0.96 handle. Just as a reminder, below this number there is the weekly support level at 0.9581 and 35 pips below that is daily support at 0.9546.
Our suggestions: With stop-loss orders below 0.96 currently being filled, along with breakout sellers’ orders (this will likely provide liquidity for the big boys to buy); we believe a long trade from between 0.9546/0.9581 is high probability today. To be on the safe side though, we would only consider a buy from here in the event that a H4 bullish rotation candle takes shape in the form of a full or near-full-bodied candle. This will, for us, confirm buyer intent.
Data points to consider: US Final GDP q/q figures, as well as the US weekly unemployment claims at 1.30pm GMT+1
Levels to watch/live orders:
- Buys: 0.9546/0.9581 ([waiting for a reasonably sized H4 bull candle to form – preferably a full-bodied candle – following the retest is advised] stop loss: ideally beyond the candle’s tail).
- Sells: Flat (stop loss: N/A).
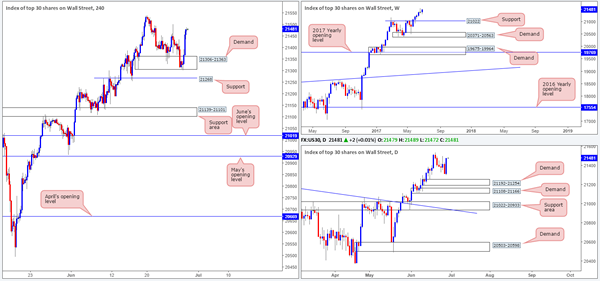
DOW 30
Unexpectedly, the H4 demand base coming in at 21306-21363 has held ground and rallied price, consequently painting a nice-looking daily bullish engulfing candle. For those who follow our analysis on a regular basis, you may recall that our desk is currently long from 21164. 50% of that position was quickly liquidated at 21234, with the remaining 50% left in the market to run since we intend on trailing this trend long term. The trailing stop was (and still is) positioned just beneath the said H4 demand zone at 21298, and thankfully was not triggered during yesterday’s trading.
Our suggestions: At the time of writing, there is not much else to hang our hat on. Of course, we would like to see the index continue advancing north and eventually register a fresh record high. From that point, we then have the freedom to move the trailing stop into further profits.
Data points to consider: US Final GDP q/q figures, as well as the US weekly unemployment claims at 1.30pm GMT+1.
Levels to watch/live orders:
- Buys: 21164 ([live] stop loss: 21298).
- Sells: Flat (stop loss: N/A).
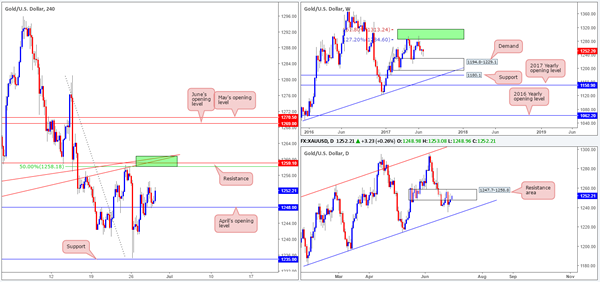
GOLD
The H4 candles, as you can see, remain afloat above April’s opening level at 1248.0. As mentioned in Wednesday’s report, continual buying from here could see price connect with the green H4 area which we deem to be a sell zone. The reasons as to why are as follows:
H4 resistance at 1259.1.
Two H4 trendline resistances taken from lows of 1245.9/1252.9.
H4 50.0% retracement value at 1258.1 taken from the high 1281.1.
Located within the upper limits of a daily resistance area at 1247.7-1258.8.
Our suggestions: We believe that H4 price will likely test the above noted green H4 sell zone today. However, with little weekly connection seen around this area, there’s a chance that a fakeout could take shape. For that reason, we will only consider a sell from here valid if, and only if, a H4 bearish candle forms, preferably a full-bodied candle.
Levels to watch/live orders:
- Buys: Flat (stop loss: N/A).
- Sells: 1259.1 region ([waiting for a reasonably sized H4 bear candle – preferably a full-bodied candle – to form before pulling the trigger is advised] stop loss: ideally beyond the candle’s wick).


