
Key Highlights
- USD/JPY is showing many bullish signs above 107.50 on the daily chart.
- A bullish breakout pattern is forming with resistance near 109.50.
- The US Initial Jobless Claims for the week ending Nov 02, 2019 declined from 219K to 211K.
- Michigan’s Consumer Sentiment Index could increase from 95.5 to 95.9 in Nov 2019 (Prelim).
USD/JPY Technical Analysis
The US Dollar mostly followed a bullish path in the past three months against the Japanese Yen. USD/JPY settled above a few key supports such as 106.80 and 107.50, signaling more upsides.
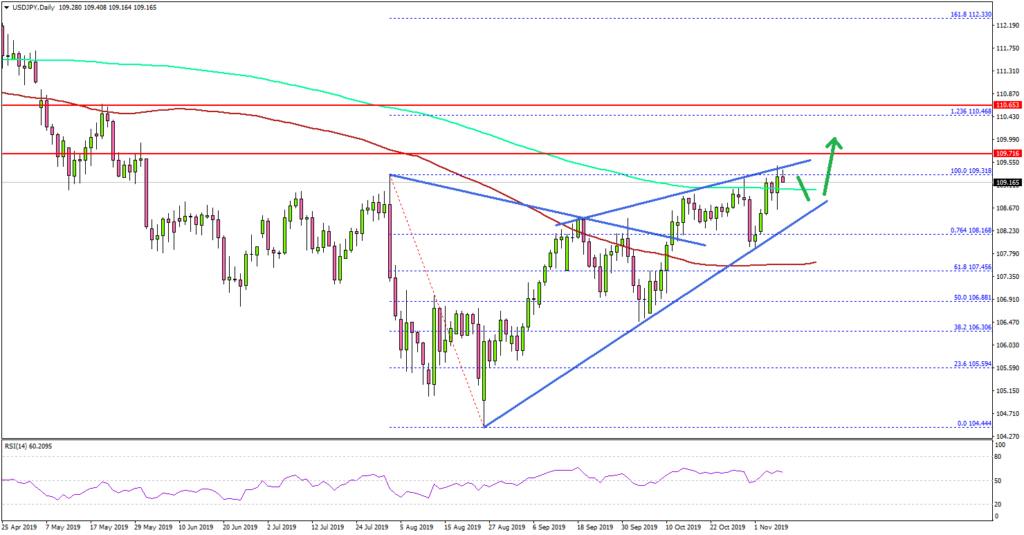
Looking at the daily chart, the pair climbed above a major bearish trend line at 107.80 on the same chart. More importantly, there was a close above 107.50 and the 100-day simple moving average.
At the outset, there is a bullish breakout pattern is forming with resistance near 109.50. If there is an upside break above the 109.50 resistance, the pair could continue to rise in the coming days.
The next major resistance is near the 110.50 level since it coincides with the 1.236 Fib extension level of the main decline from the 109.31 high to 104.44 low.
Conversely, there are many supports on the downside, starting with 108.50 and up to 107.50. Only a daily close below the 100-day SMA and 107.50 may perhaps push the pair back into a bearish zone.
Fundamentally, the Initial Jobless Claims report for the week ending Nov 02, 2019 was released by the US Department of Labor. The market was looking for a minor decline in claims from 218K to 215K.
However, the actual result was better than the forecast, as the US jobless claims fell to 211K. Moreover, the last reading was revised up from 218K to 219K.
The report added:
The 4-week moving average was 215,250, an increase of 250 from the previous week’s revised average. The previous week’s average was revised up by 250 from 214,750 to 215,000.
Overall, USD/JPY is likely to continue higher above 109.50 and 110.00. Conversely, there were mostly bearish moves in EUR/USD and GBP/USD in the past four days.
Upcoming Economic Releases
- Canada’s Net Employment Change Oct 2019 – Forecast 15.9K, versus 53.7K previous.
- Canada’s Unemployment Rate Oct 2019 – Forecast 5.5%, versus 5.5% previous.
- Michigan Consumer Sentiment Index Nov 2019 (Prelim) – Forecast 95.9, versus 95.5 previous.


