
The EUR/USD currency pair
Technical indicators of the currency pair:
Prev Open: 1.10244
Open: 1.10786
% chg. over the last day: +0.53
Day’s range: 1.10761 – 1.10788
52 wk range: 1.0884 – 1.1623
Yesterday we observed aggressive purchases on the EUR/USD currency pair. The trading instrument moved grew by more than 70 points. The US dollar has weakened significantly due to weak economic reports. ISM published the PMI in the manufacturing sector from, which amounted to 48.1 in November and turned out to be worse than the expected value of 49.2. Currently, the key support and resistance levels are 1.10600 and 1.10850, respectively. Open positions from key levels.
The Economic News Feed for 03.12.2019 is calm.
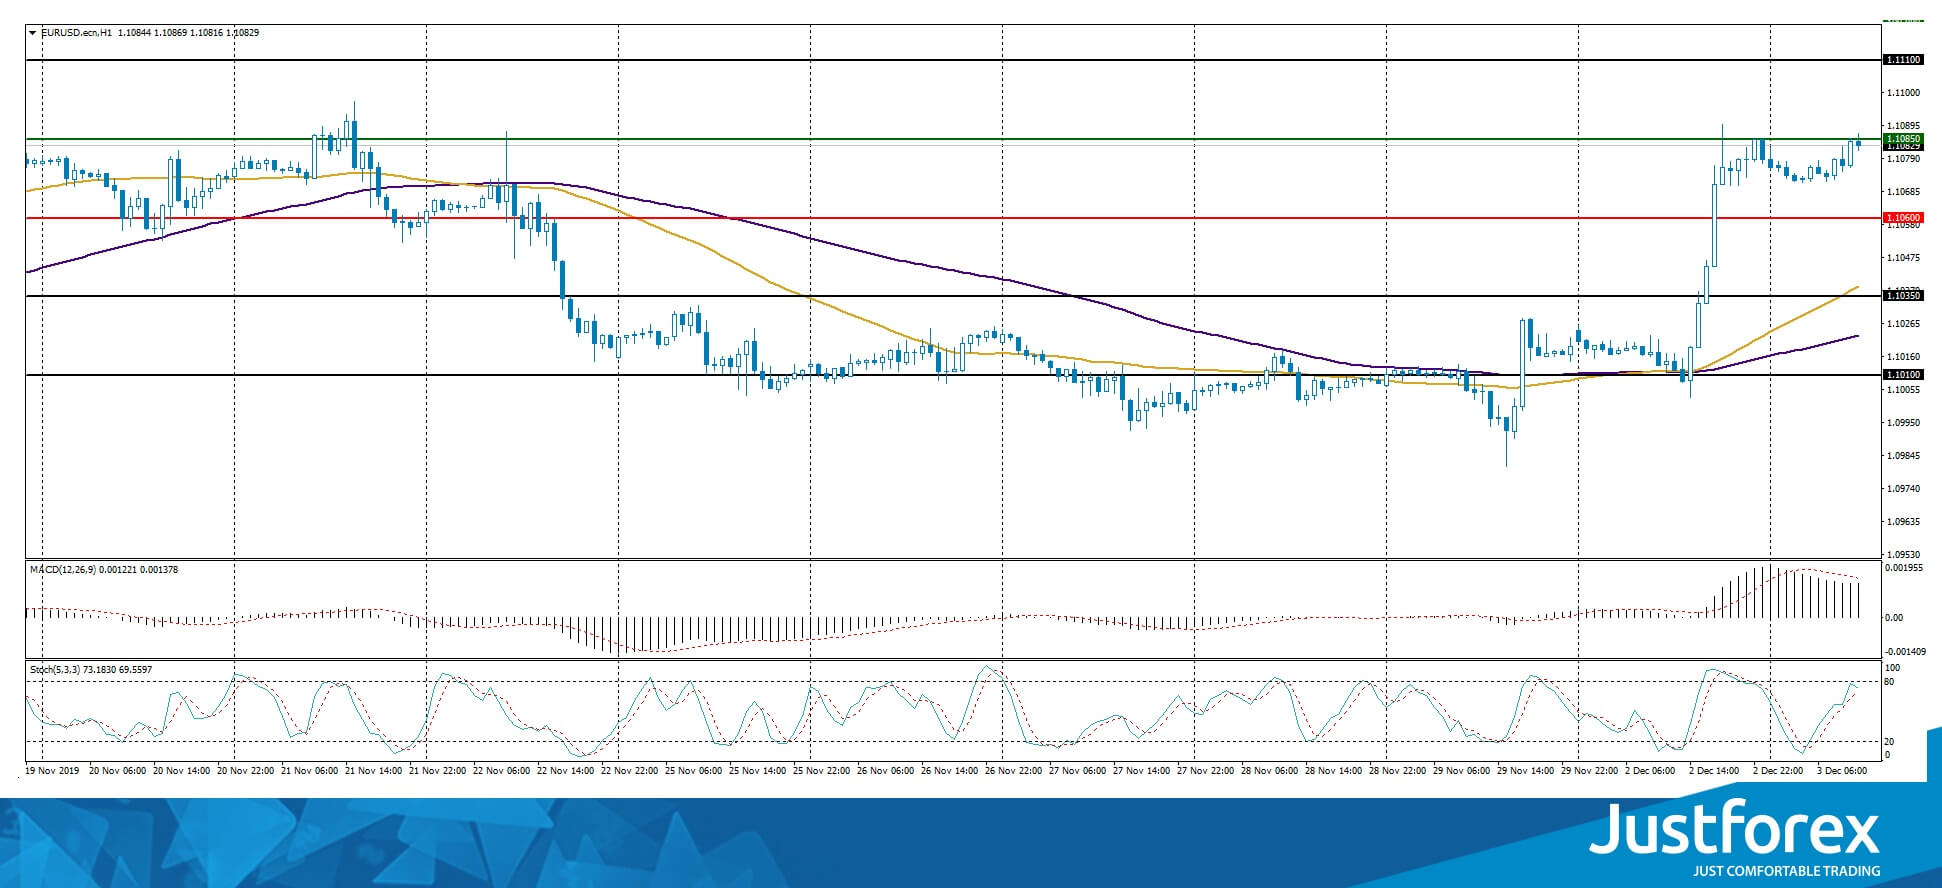
Indicators point to the bullish sentiment: the price is trading above 50 MA and 100 MA.
The MACD histogram is in the positive zone, but below the signal line, which gives a weak signal to buy EUR/USD.
The Stochastic Oscillator is in the neutral zone, the %K line is above the %D line, which also gives a signal to buy EUR/USD.
Trading recommendations
Support levels: 1.10600, 1.10350, 1.10100
Resistance levels: 1.10850, 1.11100
If the price consolidates above the resistance level of 1.10850, expect further growth toward 1.11000-1.11100
Alternatively, the quotes could reduce toward 1.10350-1.10100.
The GBP/USD currency pair
Technical indicators of the currency pair:
Prev Open: 1.29093
Open: 1.29486
% chg. over the last day: +0.21
Day’s range: 1.29652 – 1.29811
52 wk range: 1.1959 – 1.3385
On the GBP/USD currency pair, a bullish sentiment can be seen. The UK Manufacturing PMI was released yesterday, and totaled 48.9 in November which turned out to be better than the forecasted value of 48.3. Investors expect further information regarding the Brexit process. At the moment, the key support and resistance levels are still 1.29400 and 1.29900, respectively. We recommend opening positions from these marks.
The Economic News Feed for 03.12.2019:
Construction PMI (UK) – 11:30 (GMT+2:00).
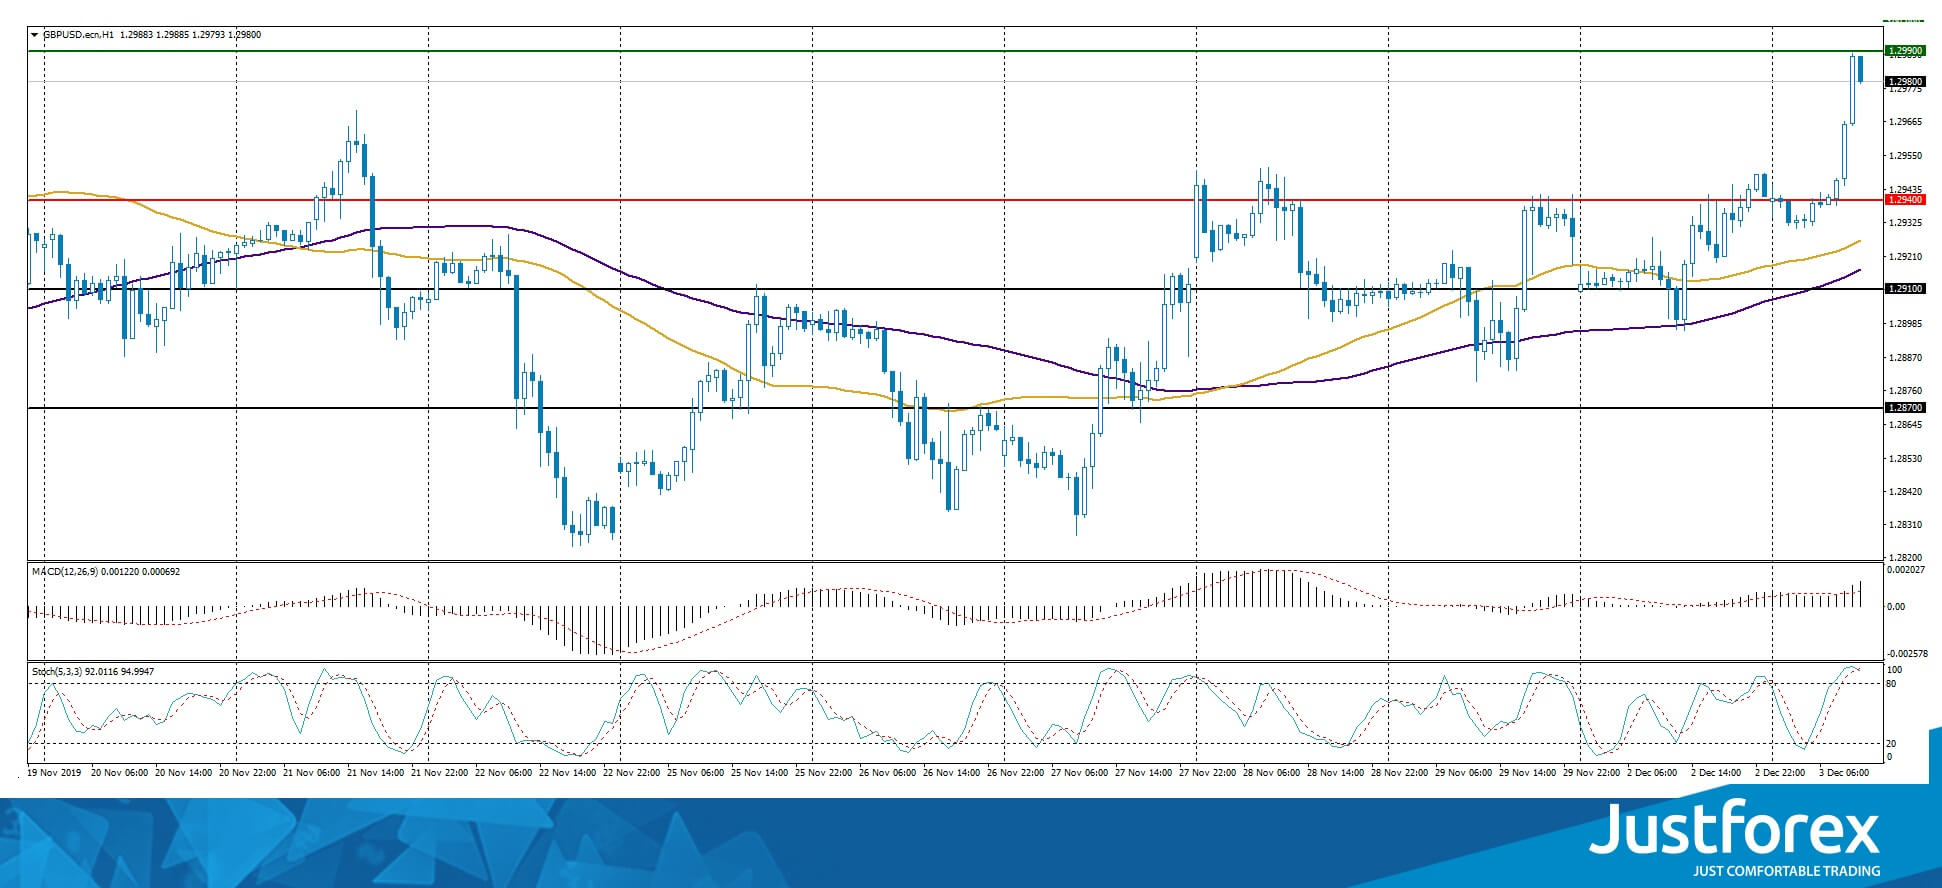
Indicators point toward bullish sentiment: the price is trading above 50 MA and 100 MA.
The MACD histogram is in the positive zone and above the signal line, which gives a strong signal to buy GBP/USD.
The Stochastic Oscillator is in the overbought zone, the %K line crosses the %D line. There are no exact signals.
Trading recommendations
Support levels: 1.29400, 1.29100, 1.28700
Resistance levels: 1.29900, 1.30200
If the price consolidates above 1.29900, expect the quotes to rise toward 1.30200.
Alternatively, the quotes could fix below 1.29400 and drop toward 1.29100-1.28900.
The USD/CAD currency pair
Technical indicators of the currency pair:
Prev Open: 1.32728
Open: 1.32971
% chg. over the last day: +0.16
Day’s range: 1.32981 – 1.33064
52 wk range: 1.2727 – 1.3664
Yesterday, the USD/CAD currency pair was in a bullish mood. However, today the quotes have moved into a decline. At the moment, the local support and resistance levels are still 1.32850 and 1.33000, respectively. Participants in financial markets expect additional drivers. We recommend paying attention to the dynamics of oil prices and open positions from key levels.
The Economic News Feed for 03.12.2019 is calm.
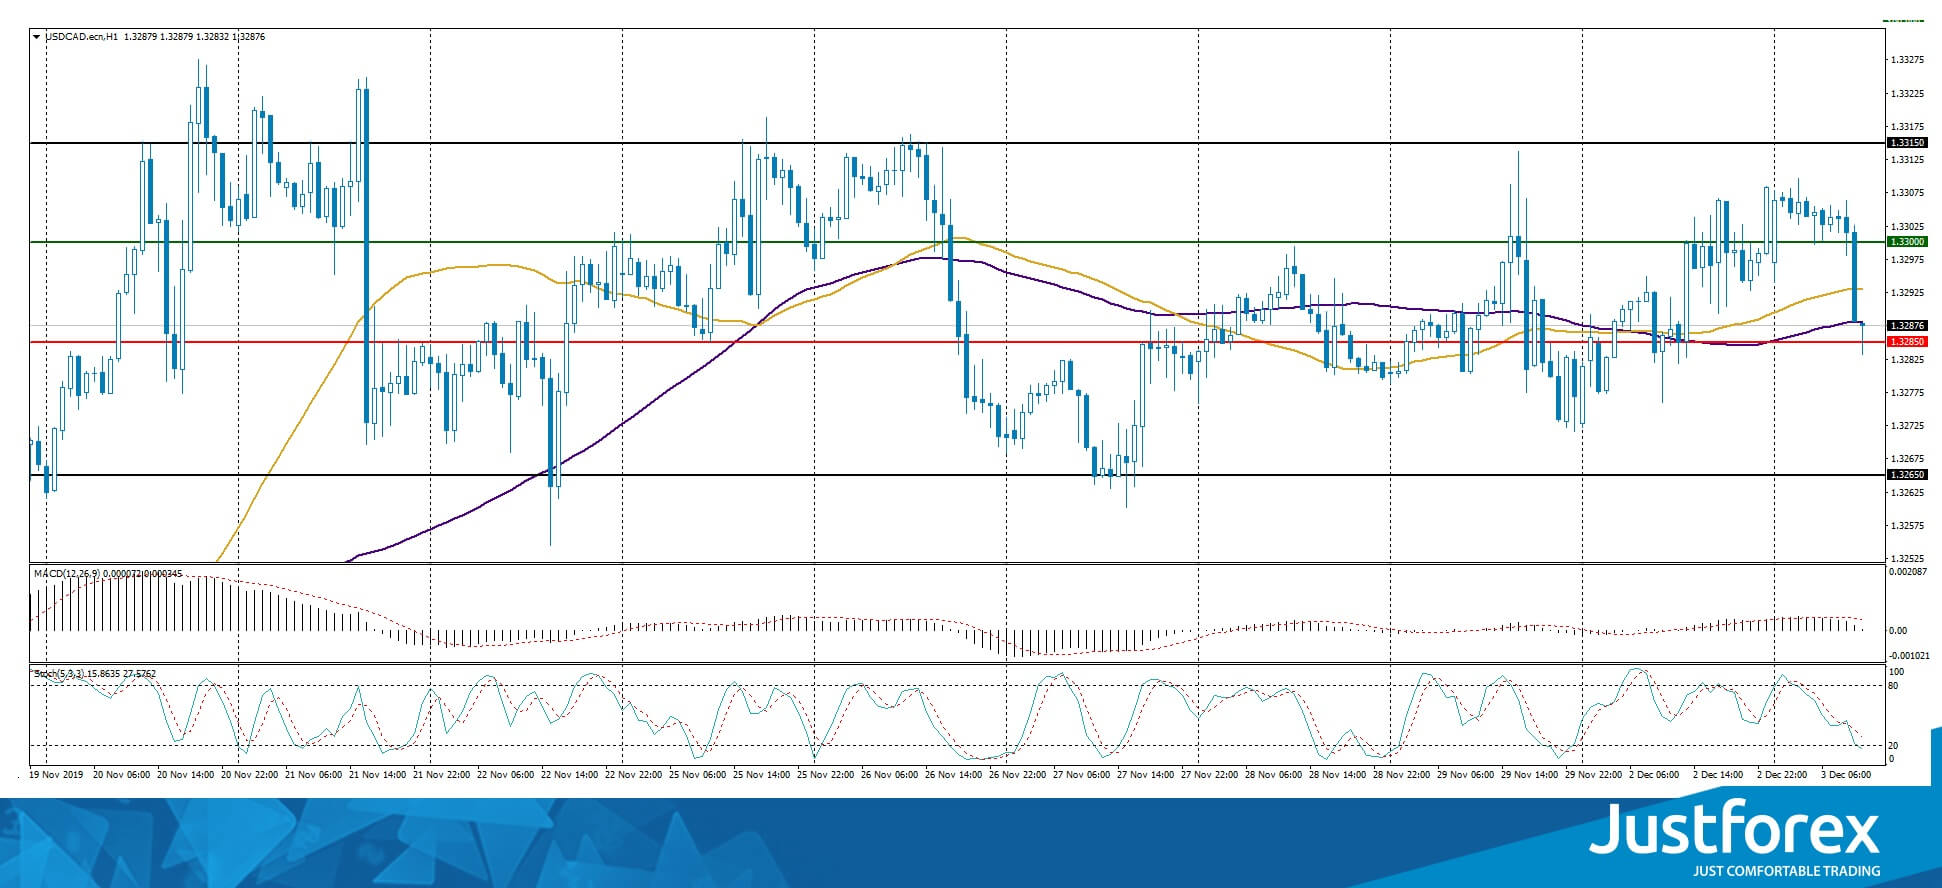
Indicators do not give accurate signals: the price crossed 50 MA and 100 MA.
The MACD histogram is in the positive zone, but below the signal line, which gives a weak signal to buy USD/CAD.
The Stochastic Oscillator is in the neutral zone, the %K line is below the %D line, which indicates a bearish sentiment.
Trading recommendations
Support levels: 1.32850, 1.32650, 1.32400
Resistance levels: 1.33000, 1.33150, 1.33400
If the price consolidates above the round level of 1.33000, expect the quotes to rise toward 1.33150-1.33400.
Alternatively, the quotes can descend toward 1.32650-1.32400.
The USD/JPY currency pair
Technical indicators of the currency pair:
Prev Open: 109.520
Open: 108.989
% chg. over the last day: -0.47
Day’s range: 109.662 – 109.696
52 wk range: 104.97 – 114.56
The USD/JPY currency pair went down. During yesterday’s trading, quotes fell by almost 70 points. Currently, the key support and resistance levels are 109,000 and 109,200, respectively. Investors are focusing on US-China relations. We also recommend that you pay attention to the dynamics of yield on US government bonds. Open positions from key levels.
The Economic News Feed for 03.12.2019 is calm.
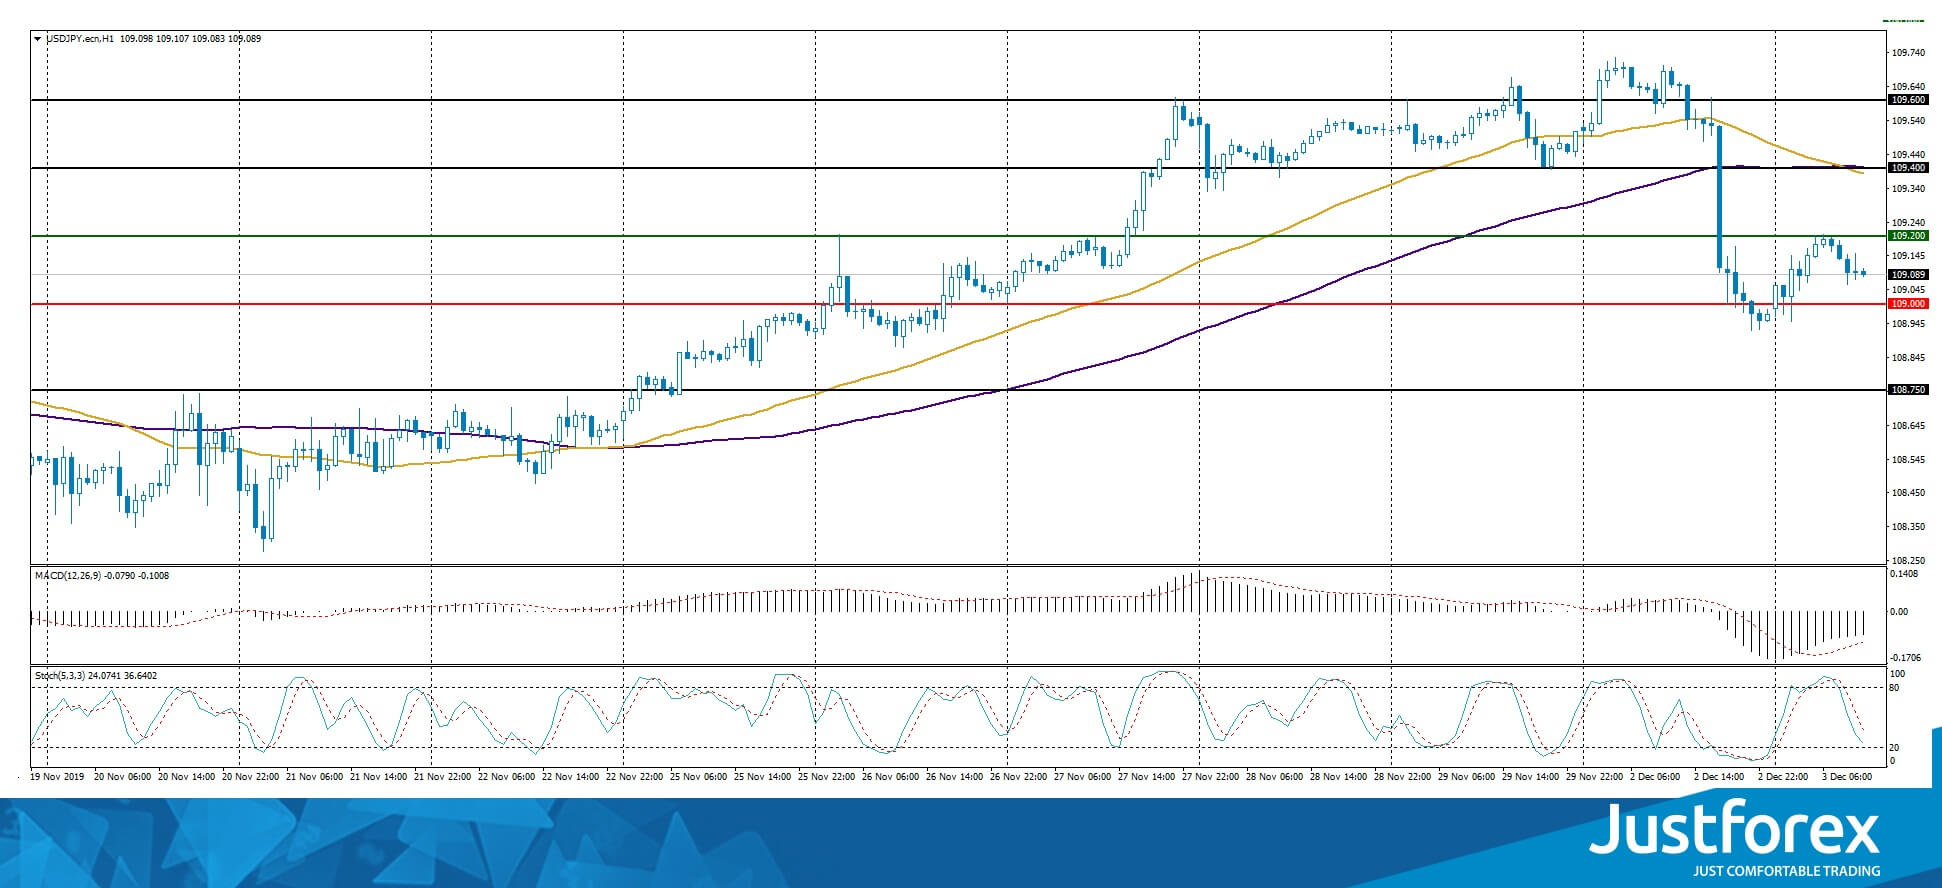
Indicators point toward the strength of sellers: the price is trading below 50 MA and 100 MA.
The MACD histogram is in the negative zone, but above the signal line, which gives a weak signal to sell USD/JPY.
The Stochastic Oscillator is in the neutral zone, the %K line is below the %D line, which gives a signal to sell USD/JPY.
Trading recommendations
Support levels: 109.000, 108.750
Resistance levels: 109.200, 109.400, 109.600
If the price consolidates below the round level of 109,000, expect the quotes to fall toward 108.750-108.600.
Alternatively, the quotes could consolidate above 109.200 and grow toward 109.400-109.600.


