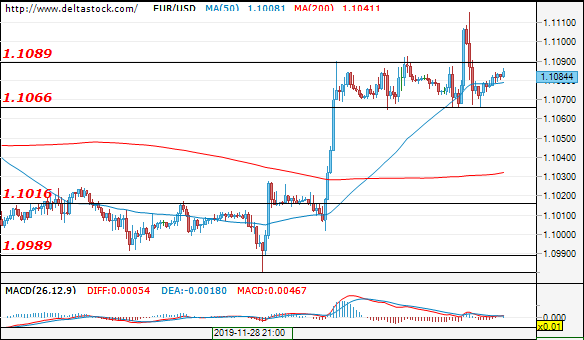
EUR/USD
Current level – 1.1084
The pair tried to continue its upward movement, but was limited to 1.1115 as bears quickly stepped in and returned the EUR/USD to the 1.1066 – 1.1089 range. Expectations are for a second test of the upper border of the consolidation range which, if broken, will pave the way towards 1.1140 and 1.1170, unless bullish momentum is lost around 1.1115. The EUR/USD might face some selling pressure if today’s Preliminary GDP and Retail sales for the Eurozone at 10:00 UK time disappoint. If they do, first support lies at the range bottom – 1.1066, followed by 1.1016.
| Resistance | Support | ||
| intraday | intraweek | intraday | intraweek |
| 1.1090 | 1.1170 | 1.1060 | 1.0990 |
| 1.1140 | 1.1190 | 1.1020 | 1.0880 |
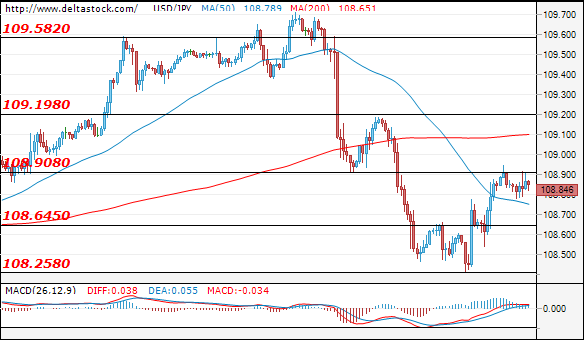
USD/JPY
Current level – 108.84
The previous support, which now acts as a resistance at around 108.90 turned out to be a major hurdle for the bulls and put an end to the upward move from the local bottom at 108.40. The main reason behind the price move was an improvement in market sentiment due to new reports stating that the US and China are moving closer to a trade deal despite the heated rhetoric around Hongkong. Despite that, the sentiment remains bearish, with the first strong support being 108.25, unless we get some good news regarding the above mentioned events. In an upward direction, a new test of the resistance at 108.90 is possible and an eventual break would direct the pair to the next resistance test at 109.19.
| Resistance | Support | ||
| intraday | intraweek | intraday | intraweek |
| 108.90 | 109.60 | 108.65 | 107.05 |
| 109.20 | 110.50 | 108.25 | 106.60 |
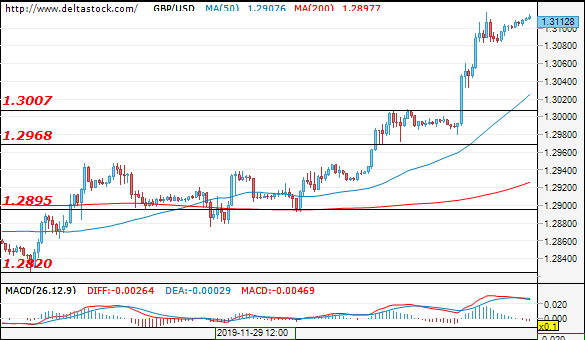
GBP/USD
Current level – 1.3112
The pound recorded a strong session yesterday after an euphoric rally helped Cable to finally break out from the 1.2820 – 1.3007 range, reaching seven-month highs at 1.3119. The pair is set to continue its upward movement as the first resistance is 1.3170. Any corrections should be limited to the upper border of the range at 1.3007.
| Resistance | Support | ||
| intraday | intraweek | intraday | intraweek |
| 1.3170 | 1.3255 | 1.3000 | 1.2890 |
| 1.3214 | 1.3320 | 1.2960 | 1.2820 |