
The EUR/USD currency pair
Technical indicators of the currency pair:
Prev Open: 1.10773
Open: 1.11023
% chg. over the last day: +0.23
Day’s range: 1.11030 – 1.11055
52 wk range: 1.0884 – 1.1623
During yesterday’s trading, the EUR/USD quotes went up. Yesterday a positive report was published on the number of initial applications for unemployment benefits in the United States. So, the number of applications decreased to 203K, while experts expected 215K. Currently, the key support and resistance levels are 1.10900 and 1.11200, respectively. Open positions from these marks. We recommend that you pay attention to the US labor market reports.
The Economic News Feed for 06.12.2019:
Labour Market Report (US) – 15:30 (GMT+2:00);
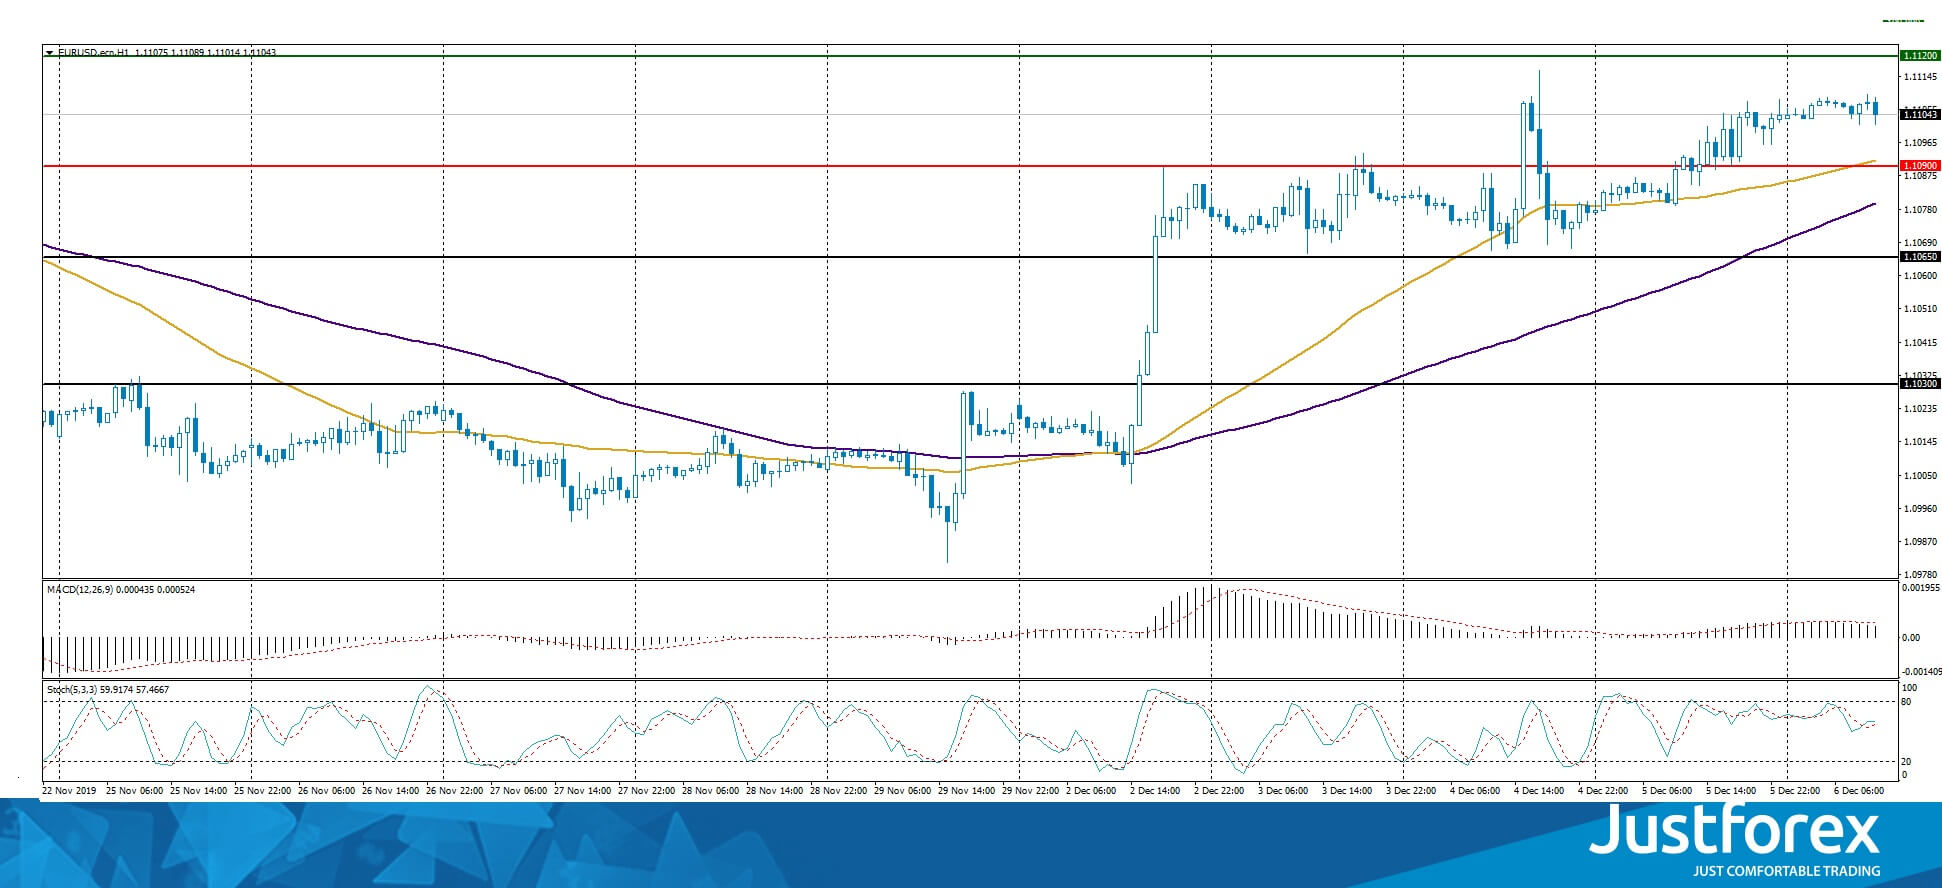
Indicators point to the strength of buyers: the price has fixed above 50 MA and 100 MA.
The MACD histogram is in the positive zone, but below the signal line, which gives a weak signal to buy EUR/USD.
Stochastic Oscillator is in the neutral zone, the %K line crossed the %D line. There are no signals.
Trading recommendations
Support levels: 1.10900, 1.10650, 1.10300
Resistance levels: 1.11200, 1.11500
If the price consolidates above the resistance level of 1.11200, expect further growth to 1.11500.
Alternatively, the quotes could consolidate below 1.10900 and descend toward 1.10650-1.10500.
The GBP/USD currency pair
Technical indicators of the currency pair:
Prev Open: 1.31032
Open: 1.31622
% chg. over the last day: +0.42
Day’s range: 1.31280 – 1.31600
52 wk range: 1.1959 – 1.3385
During yesterday’s trading, the GBP/USD trading instrument increased slightly. Participants in financial markets expect a choice in the UK parliament on the Brexit issue, due on December 12th. At the moment, the key support level is 1.31000. The key resistance level is 1.30600. We recommend opening positions from these marks.
Today, we do not expect any news from UK.
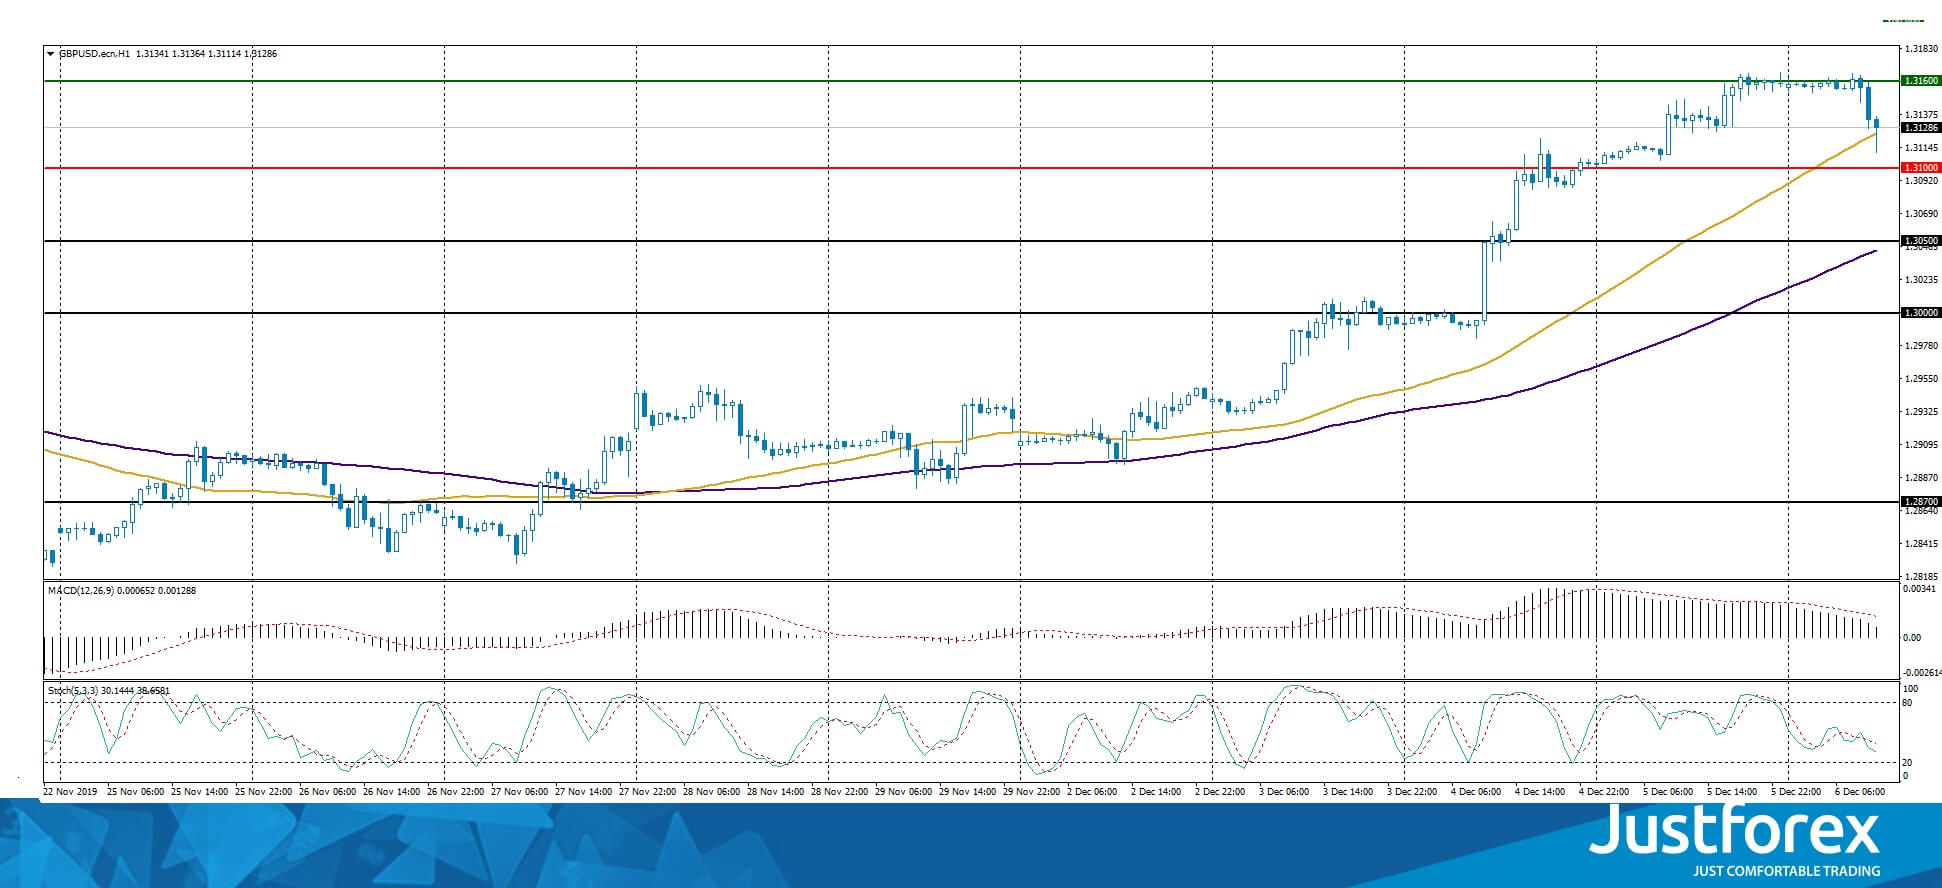
Indicators indicate bullish sentiment: the price is being traded above 50 MA and 100 MA.
The MACD histogram is in the positive zone, but below the signal line, which gives a weak signal to buy GBP/USD.
The Stochastic Oscillator is in the neutral zone, the %K line crossed the %D line. There are no signals.
Trading recommendations
Support levels: 1.31000, 1.30500, 1.30000
Resistance levels: 1.31600, 1.31800
If the price consolidates above 1.31600, expect further growth toward 1.32000.
Alternatively, the quotes will fix below 1.31000 and descend toward 1.30500-1.30300.
The USD/CAD currency pair
Technical indicators of the currency pair:
Prev Open: 1.32003
Open: 1.31781
% chg. over the last day: -0.20
Day’s range: 1.31716 – 1.31732
52 wk range: 1.2727 – 1.3664
During yesterday’s trading, the trading tool USD/CAD slightly decreased. Canada released an optimistic economic reportyesterday, which supported the Canadian dollar. Thus, the Ivey business activity index (PMI) rose to 60.0 in November, although experts predicted a value of 53.8. At present, the local support and resistance levels are 1.31600 and 1.31900, respectively. We recommend paying attention to the dynamics of oil prices. Open positions from key levels.
Today at 15:30 (GMT+2:00) the data on the labor market of Canada will be published.
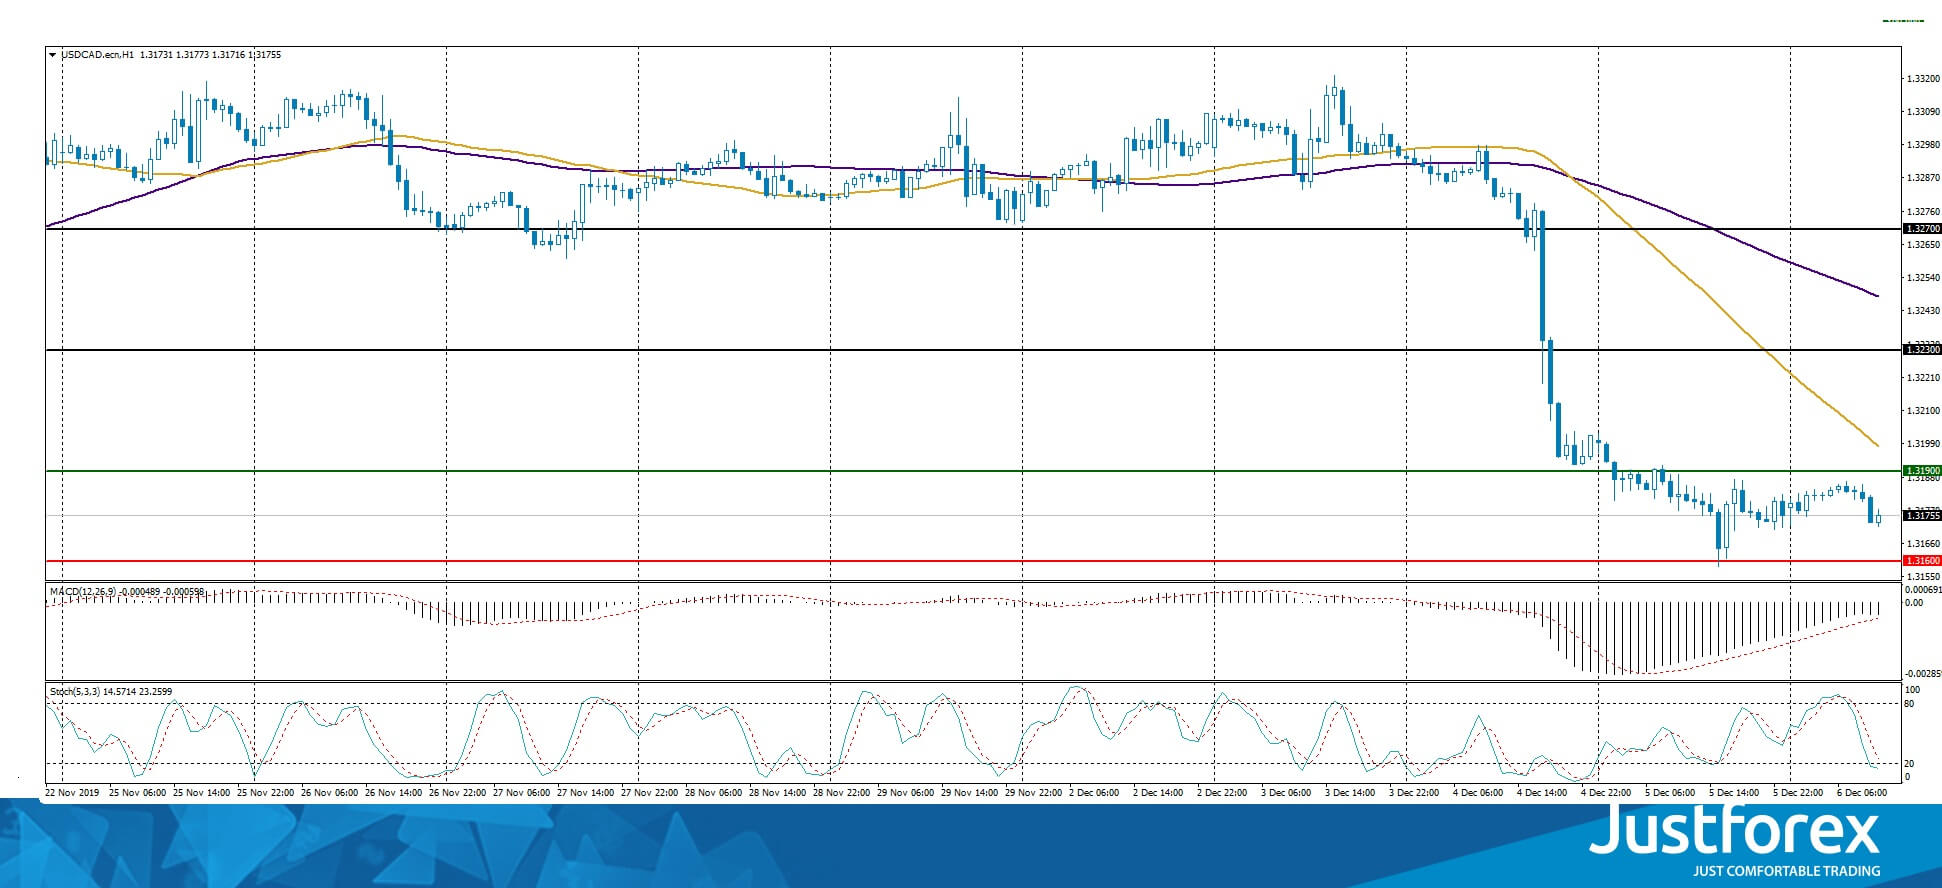
Indicators point to a bearish sentiment: the price is trading below 50 MA and 100 MA.
The MACD histogram is in the negative zone, but above the signal line, which gives a weak signal to sell USD/CAD.
The Stochastic Oscillator is in the oversold zone, the %K line is below the %D line, which also gives a signal to sell USD/CAD.
Trading recommendations
Support levels: 1.31600, 1.31400
Resistance levels: 1.31900, 1.32300, 1.32700
If the price consolidates below 1.31600, expect further decline toward 1.31400-1.31200.
Alternatively, the quotes could grow toward 1.32300-1.32500.
The USD/JPY currency pair
Technical indicators of the currency pair:
Prev Open: 108.859
Open: 108.748
% chg. over the last day: -0.12
Day’s range: 108.574 – 108.600
52 wk range: 104.97 – 114.56
The USD/JPY currency pair went down due to the uncertainty surrounding Sino-US trade relations. Investors are interested in buying a safe haven currency. Currently, the key support and resistance levels are 108.500 and 108.800, respectively. Participants in financial markets expect additional drivers. We also recommend that you pay attention to the dynamics of yield on US government bonds. The trading instrument has the potential to further decline. Open positions from key levels.
The Economic News Feed for 06.12.2019 is calm.
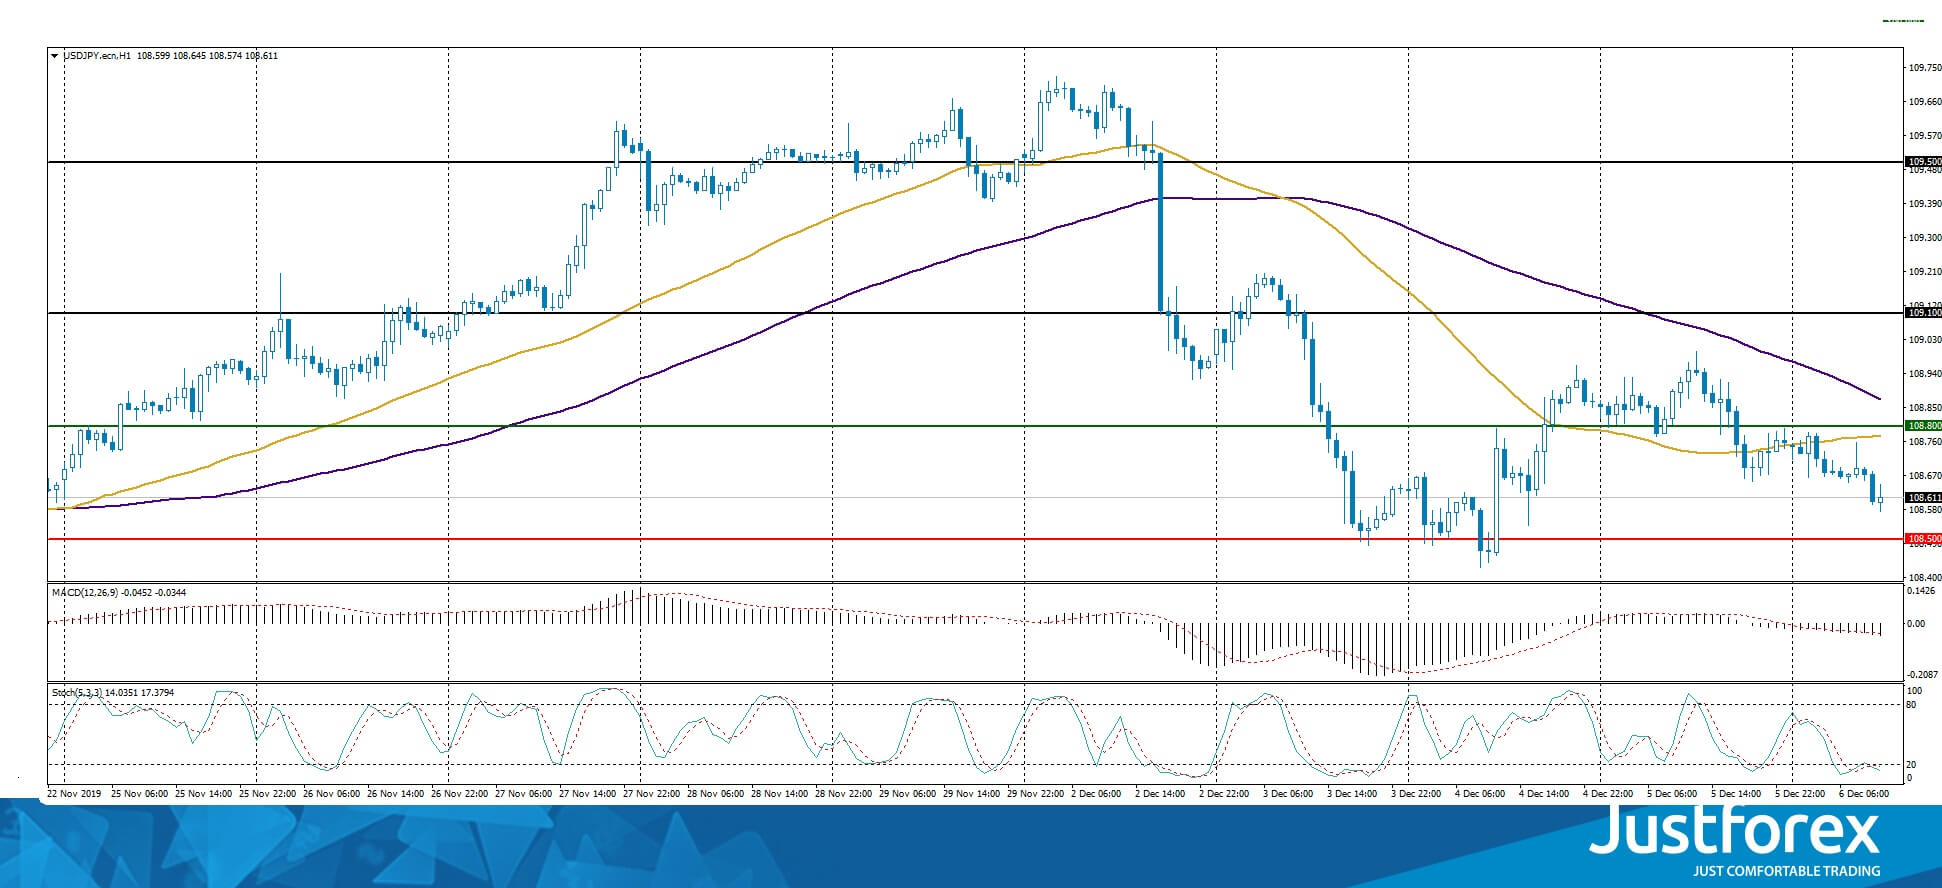
Indicators point to the strength of sellers: the price is being traded below 50 MA and 100 MA.
The MACD histogram is in the negative zone, below the signal line, which gives a strong signal to sell USD/JPY.
The Stochastic Oscillator is in the oversold zone, the %K line crosses the %D line. There are no exact signals.
Trading recommendations
Support levels: 108.500, 108.250
Resistance levels: 108.800. 109.100, 109.500
If the price consolidates below the key support level of 108.500, expect the quotes to drop toward 108.250-108.100.
Alternatively, the quotes could grow toward 109.100-109.350.


