
The EUR/USD currency pair
Technical indicators of the currency pair:
Prev Open: 1.10773
Open: 1.10582
% chg. over the last day: -0,41
Day’s range: 1.10612 – 1.10650
52 wk range: 1,0884 – 1,1623
During Friday’s trading, the EUR/USD quotes fell. An optimistic report on the US labor market were published on Friday, which propped up the USD. Thus, the number of employees in the non-agricultural sector of the United States grew by 266K instead of 186K. The unemployment rate was 3.5% instead of the predicted value of 3.6%. Currently, the key support and resistance levels are 1.10550 and 1.10800, respectively. Open positions from these marks.
The Economic News Feed for 09.12.2019 is calm.
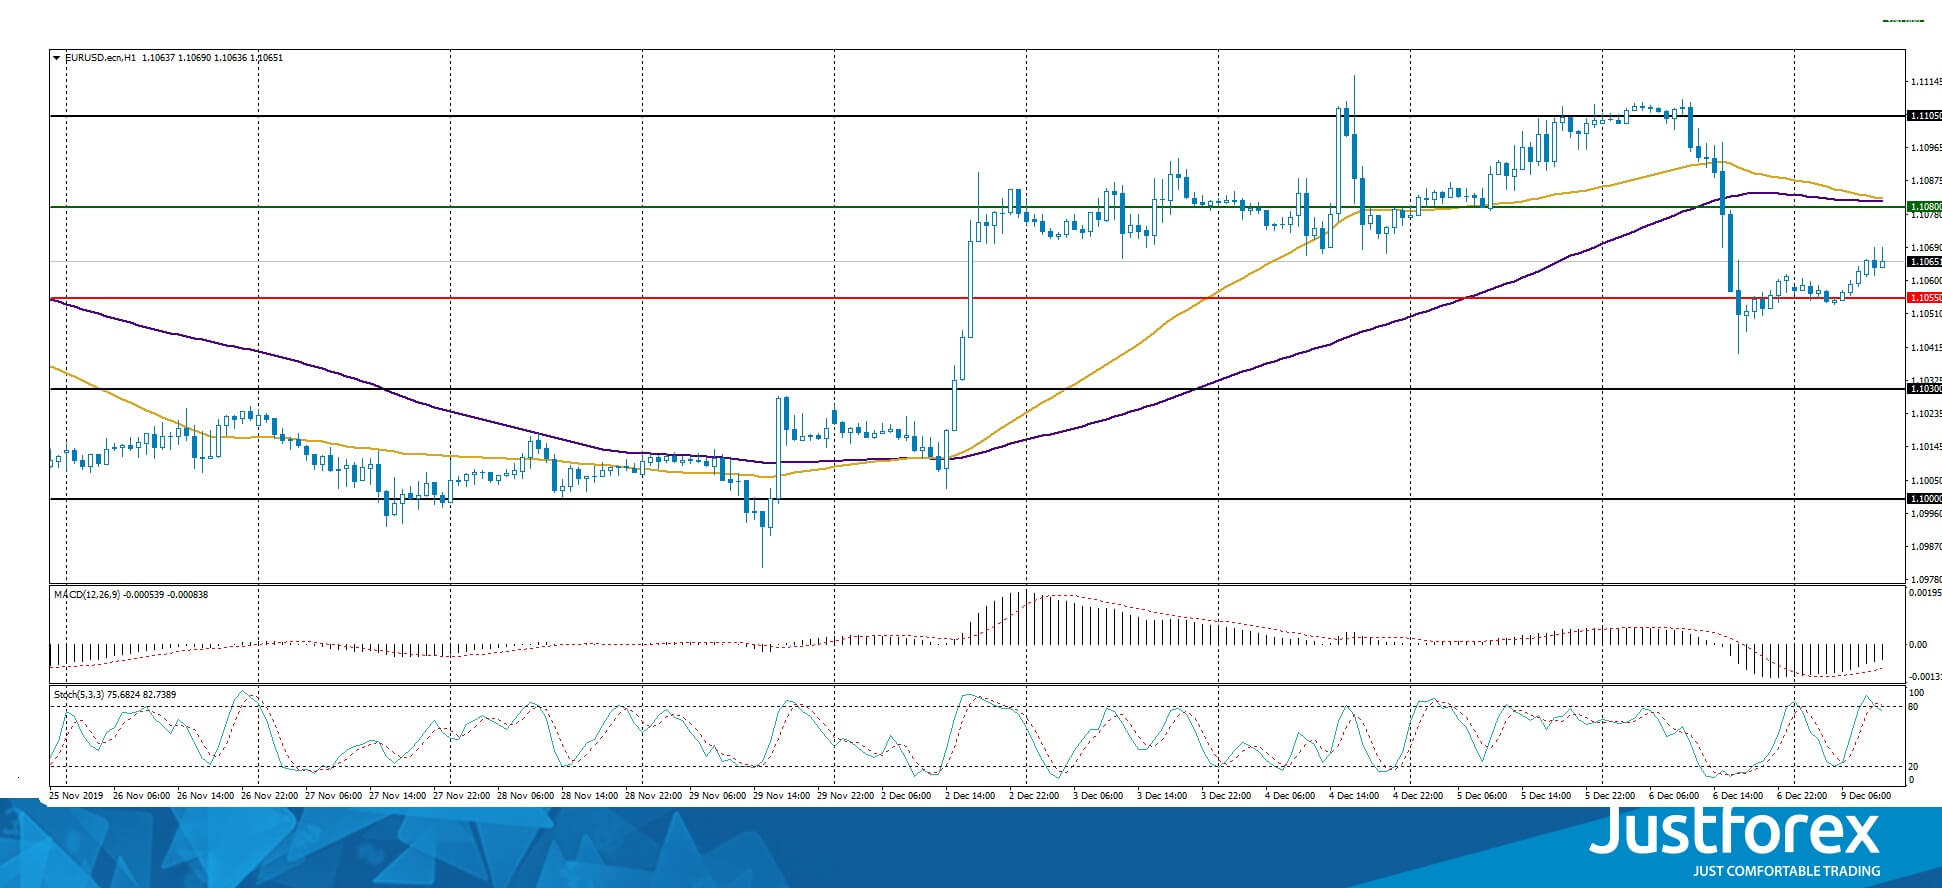
Indicators indicate the strength of sellers: the price is being traded below 50 MA and 100 MA.
The MACD histogram is in the negative zone, but above the signal line, which gives a weak signal to sell EUR/USD.
The Stochastic Oscillator is in the overbought zone, the %K line is above the %D line, which gives a weak signal to buy EUR/USD.
Trading recommendations
Support levels: 1.10550, 1.10300, 1.10000
Resistance levels: 1.10800, 1.11050
If the price consolidates below 1.10550, expect the quotes to descend toward 1.10000
Alternative ly, the price could fix above 1.10800 amd rise toward 1.11050-1.11300.
The GBP/USD currency pair
Technical indicators of the currency pair:
Prev Open: 1.31622
Open: 1.31350
% chg. over the last day: -0.15
Day’s range: 1.31506 – 1.31580
52 wk range: 1.1959 – 1.3385
GBP/USD does not show a defined trend. Participants in financial markets are waiting for a vote in the UK parliament on the Brexit issue, due on December 12th. At the moment, the key support level is 1.31400. The key resistance level is 1.31800. We recommend opening positions from these marks.
The Economic News Feed for 09.12.2019 is calm.
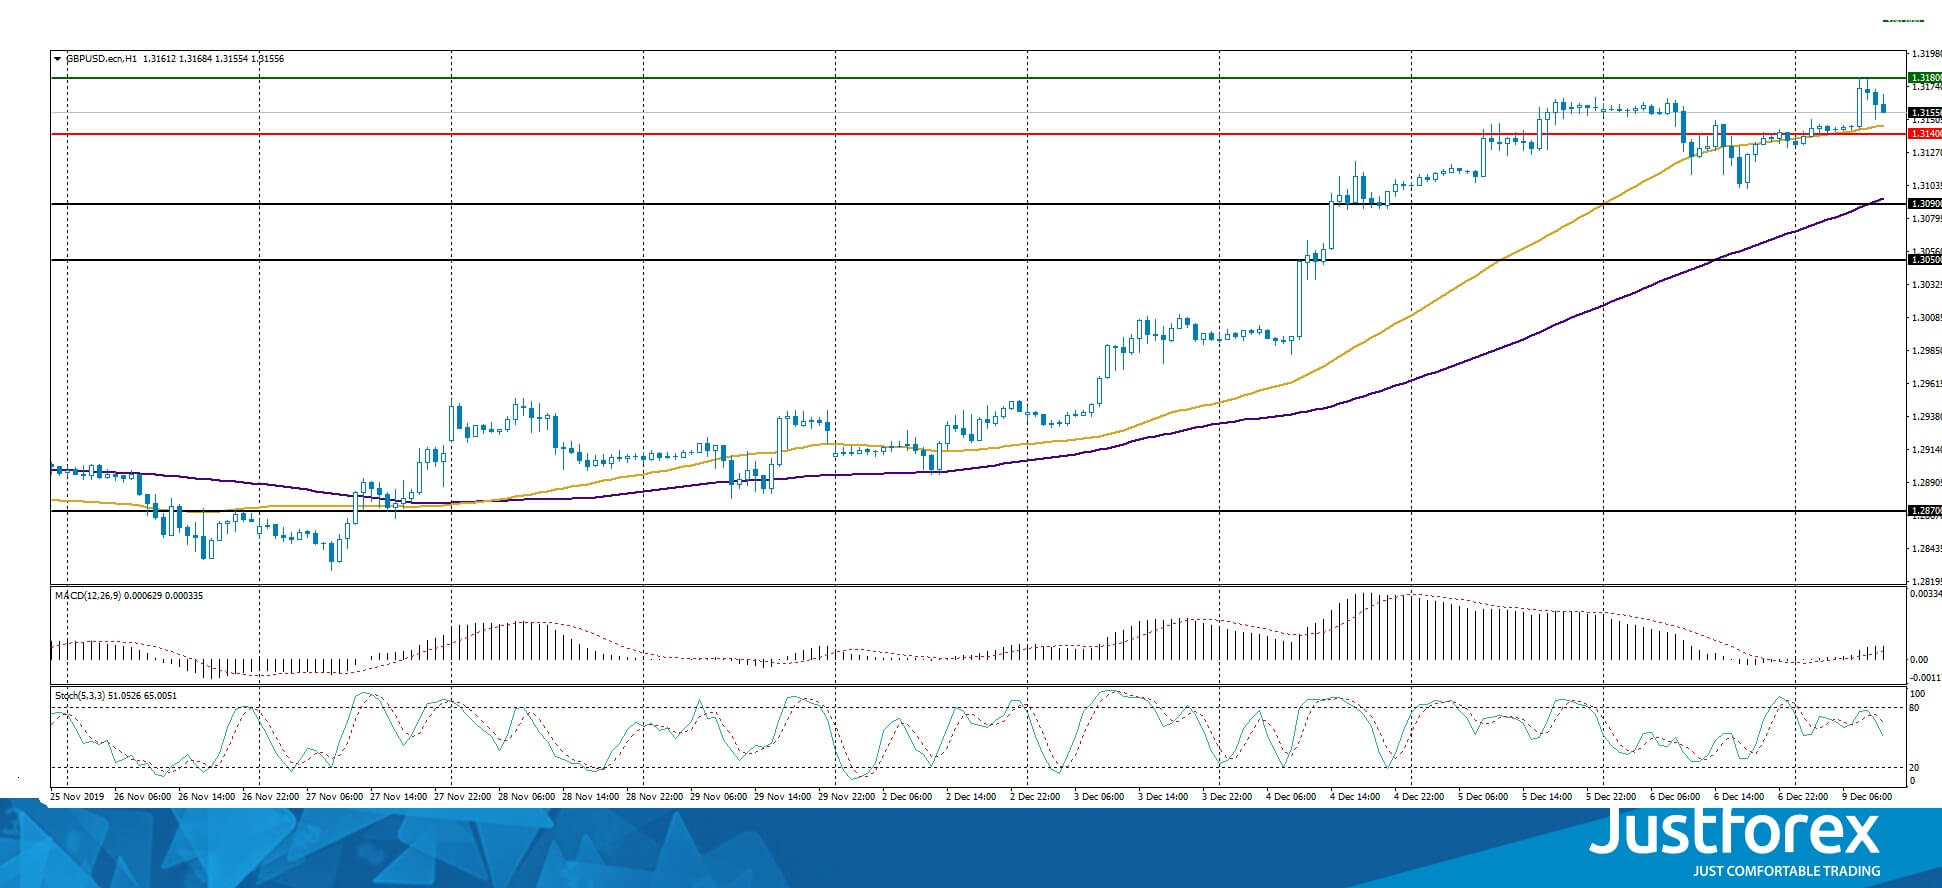
Indicators point to a bullish sentiment: the price is being traded above 50 MA and 100 MA.
The MACD histogram is in the positive zone, above the signal line, which gives a strong signal to buy GBP/USD.
The Stochastic Oscillator is near the overbought zone, the %K line crossed the %D line. There are no signals.
Trading recommendations
Support levels: 1.31400, 1.30900, 1.30500
Resistance levels: 1.31800, 1.32000
If the price consolidates above 1.31800, expect the quotes to rise toward 1.32000.
Alternatively, the quotes could fix below 1.31400 and the pair could decline toward 1.30900-1.30700.
The USD/CAD currency pair
Technical indicators of the currency pair:
Prev Open: 1.31781
Open: 1.32520
% chg. over the last day: +0.62
Day’s range: 1.32608 – 1.32650
52 wk range: 1.2727 – 1.3664
During Friday’s trading, the USD/CAD quotes increased significantly. The trading instrument grew by almost 100 points. The USD was supported by optimistic economic reports. Quotes are currently being consolidated. Investors expect additional drivers. The local support and resistance levels are 1.32300 and 1.32700, respectively. We recommend paying attention to the dynamics of oil prices. Open positions from key levels.
The Economic News Feed for 09.12.2019 is calm.
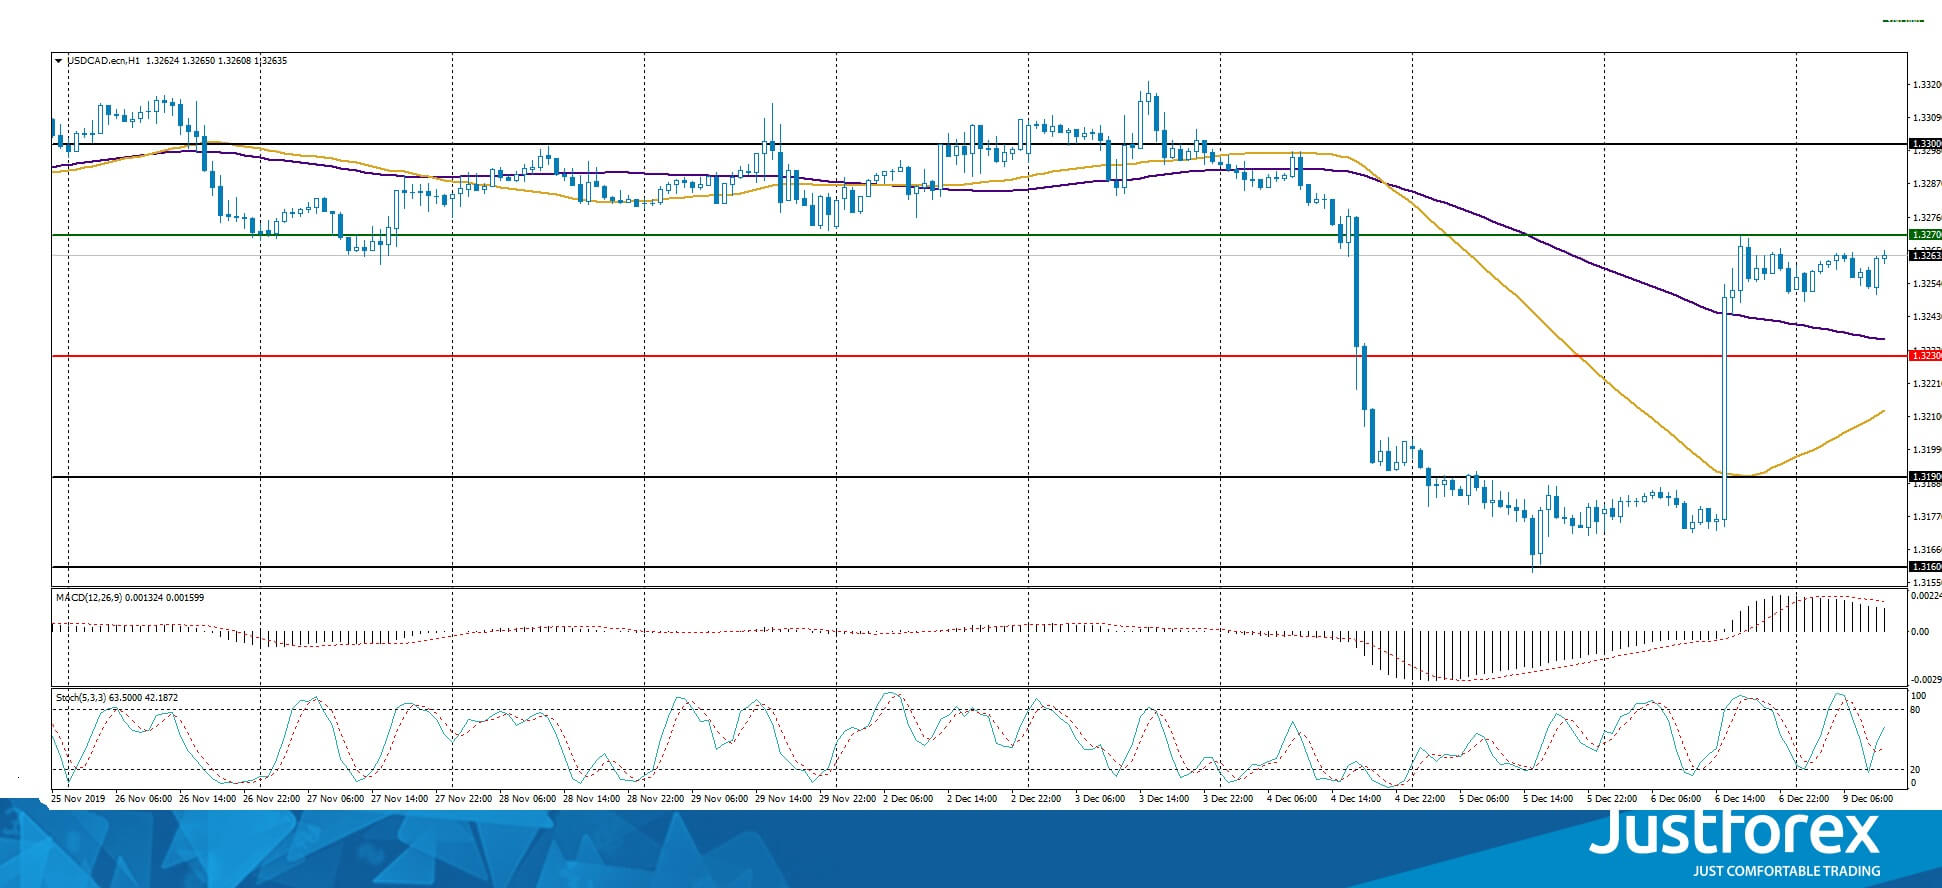
Indicators point to a bullish sentiment: the price is being traded above 50 MA and 100 MA.
The MACD histogram is in the positive zone, but below the signal line, which gives a weak signal to buy USD/CAD.
The Stochastic Oscillator is in the neutral zone, the %K line is above the %D line, which also gives a signal to buy USD/CAD.
Trading recommendations
Support levels: 1.32300, 1.31900, 1.31600
Resistance levels: 1.32700, 1.33000
If the price consolidates above 1.32700, expect further growth toward 1.33000.
Alternatively, the quotes could descend toward 1.32300-1.32100.
The USD/JPY currency pair
Technical indicators of the currency pair:
Prev Open: 108.748
Open: 108.360
% chg. over the last day: -0.14
Day’s range: 108.574 – 108.600
52 wk range: 104.97 – 114.56
A variety of trends was observed on Friday on the USD/JPY currency pair. Investors are awaiting new information regarding US-China trade relations. Currently, the key support and resistance levels are 108.450 and 108.650, respectively. We also recommend that you pay attention to the dynamics of yield on US government bonds. Open positions from key levels.
During the Asian trading session, Japan published an optimistic GDP report.
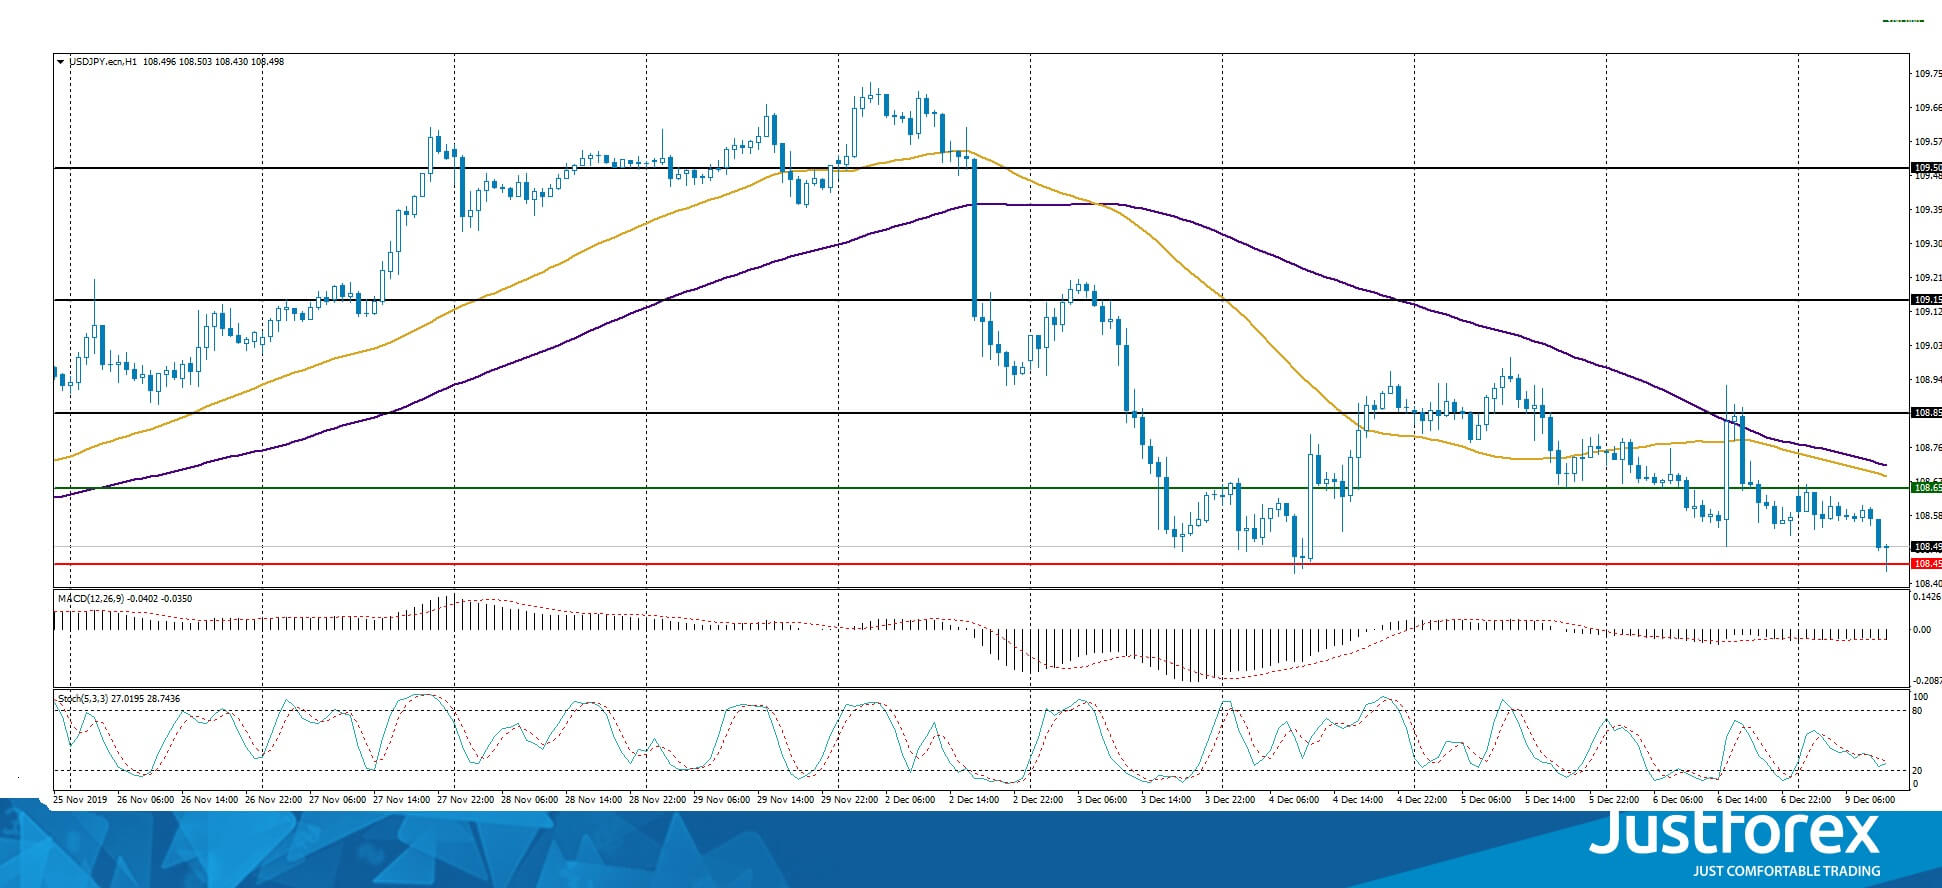
Indicators point to the strength of sellers: the price is being traded below 50 MA and 100 MA.
The MACD histogram is in the negative zone, below the signal line, which gives a strong signal to sell USD/JPY.
The Stochastic Oscillator is located near the oversold zone, the %K line crosses the %D line. There are no exact signals.
Trading recommendations
Support levels: 108.450, 108.250
Resistance levels: 108.650, 108.850, 109.150
If the price consolidates below the key support level of 108.450, expect the quotes to drop toward 108.250-108.100.
Alternatively, the quotes could grow toward 108.850-109.000.


