
The EUR/USD currency pair
Technical indicators of the currency pair:
Prev Open: 1.10638
Open: 1.10885
% chg. over the last day: +0.26
Day’s range: 1.10818 – 1.10848
52 wk range: 1.0884 – 1.1623
The EUR/USD currency pair slightly increased during yesterday’s trading. At the moment, the technical pattern is ambiguous. Investors took a wait and see attitude before the Fed meeting, which will begin today and end tomorrow. Currently, the key support and resistance levels are 1.10700 and 1.10900, respectively. Open positions from these marks. We also recommend you to pay attention to the publication of important economic reports from the United States.
The Economic News Feed for 11.12.2019:
Basis Consumer Price Index (US) – 15:30 (GMT+2:00);
Fed Interest Rate Decision (US) – 21:00 (GMT+2:00);
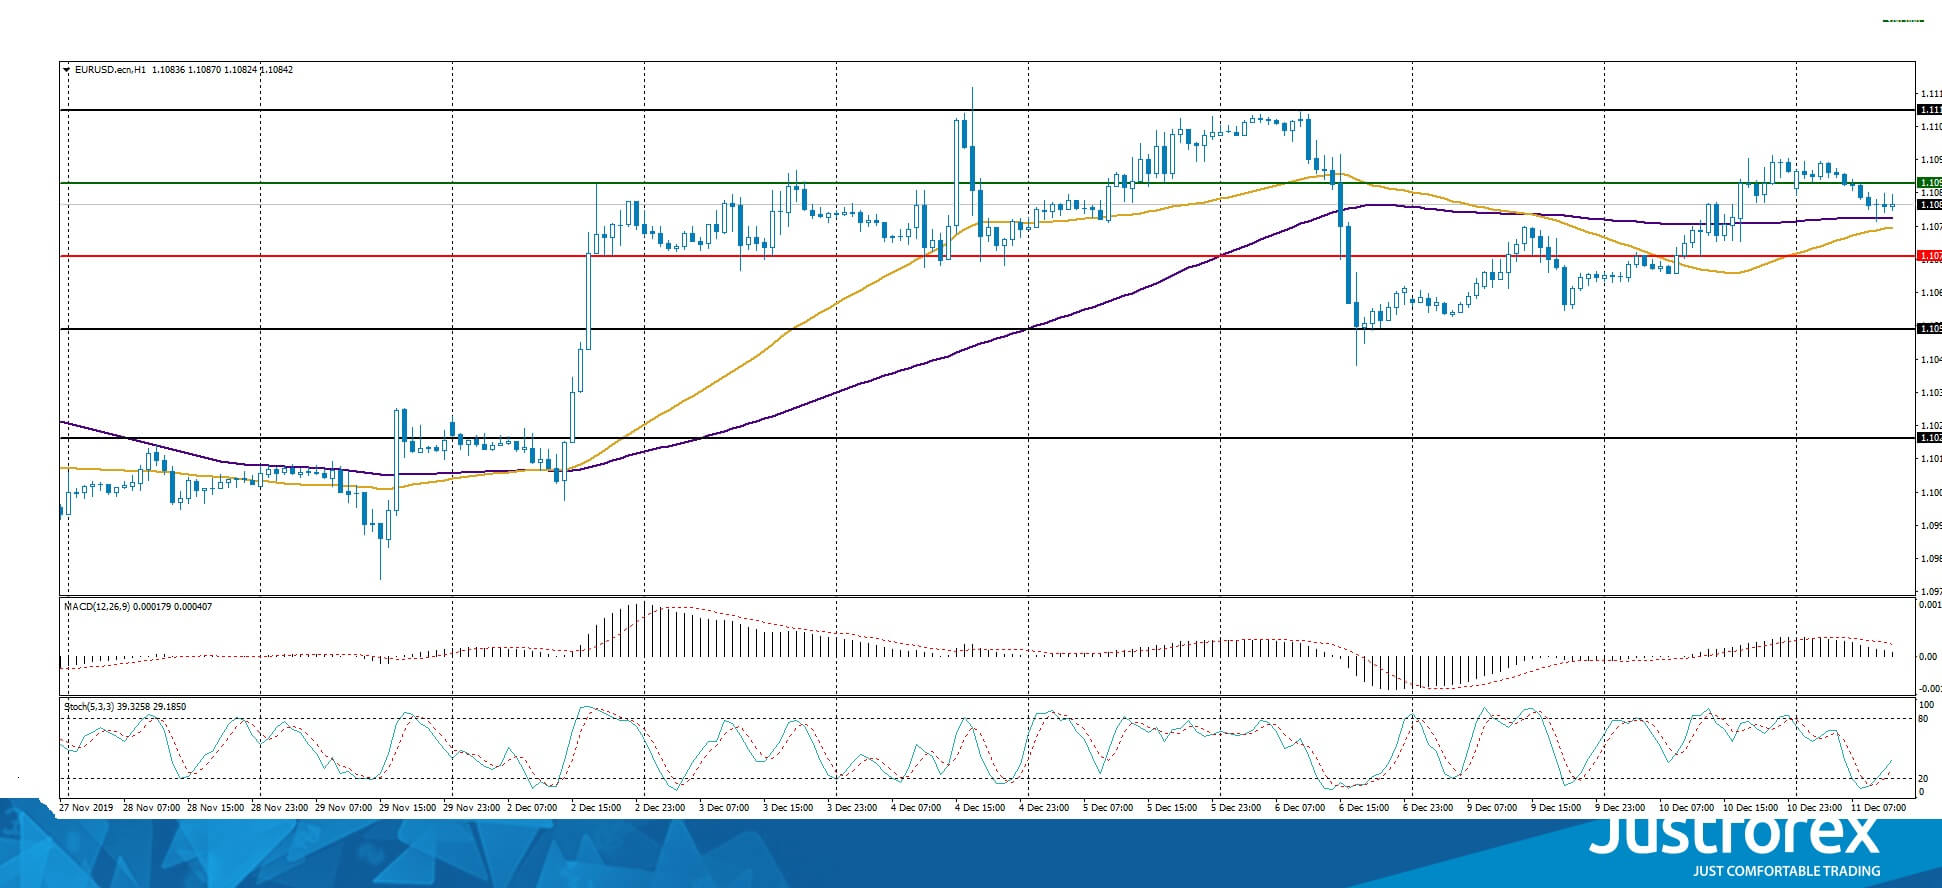
Indicators point to the strength of buyers: the price is being traded above 50 MA and 100 MA.
The MACD histogram is in the positive zone, but below the signal line, which gives a weak signal to buy EUR/USD.
The Stochastic Oscillator is near the oversold zone, the %K line is above the %D line, which indicates bullish sentiment.
Trading recommendations
Support levels: 1.10700, 1.10500, 1.10200
Resistance levels: 1.10900, 1.11100
If the price consolidates below the level of 1.10700, expect a decrease to 1.10500-1.10400.
If the price consolidates above the resistance level of 1.10900, expect an uprising toward 1.11100-1.11300.
The GBP/USD currency pair
Technical indicators of the currency pair:
Prev Open: 1.31391
Open: 1.31546
% chg. over the last day: -0.12
Day’s range: 1.31357 – 1.31475
52 wk range: 1.1959 – 1.3385
In the course of yesterday’s trading on the GBP/USD currency pair, multidirectional dynamics was observed. The British pound was supported by optimistic economic data from the UK. So, GDP (q / q) did not change in the third quarter, although experts expected a decrease of 0.2%. GDP (YoY) grew in the third quarter by 0.7%, which coincided with the expectations of experts. The volume of production in the manufacturing industry grew in October by 0.2% instead of 0.1%. At the moment, the key support level is 1.31200. The key resistance level is 1.31600. We recommend opening positions from these marks.
The Economic News Feed for 11.12.2019 is calm.
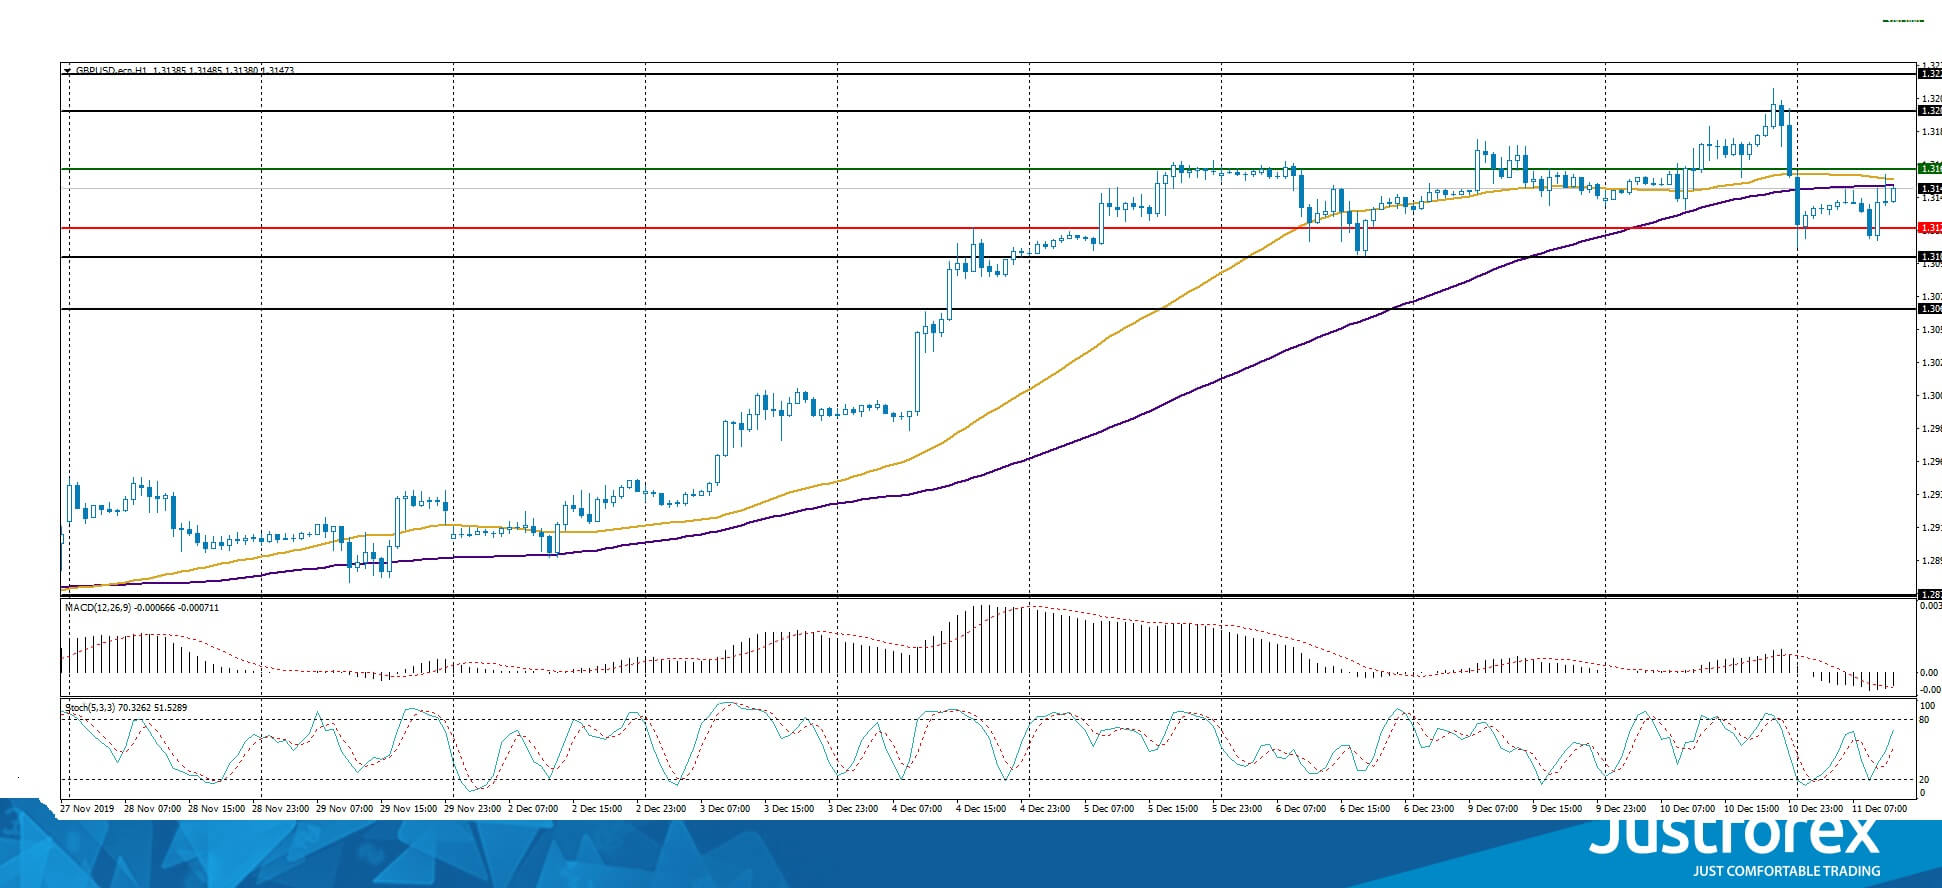
Indicators do not provide accurate signals: the price has crossed 50 MA and 100 MA.
The MACD histogram is in the negative zone, but above the signal line, which gives a weak signal to sell GBP/USD.
The Stochastic Oscillator is in the neutral zone, the %K line crossed %D. There are no signals.
Trading recommendations
Support levels: 1.31200, 1.31000, 1.30650
Resistance levels: 1.31600, 1.32000, 1.32250
If the price consolidates above 1.31600, expect the quotes to rise toward 1.32000.
Alternatively, the quotes could descend toward 1.31000.
The USD/CAD currency pair
Technical indicators of the currency pair:
Prev Open: 1.32366
Open: 1.32300
% chg. over the last day: -0.03
Day’s range: 1.32266 – 1.32384
52 wk range: 1.2727 – 1.3664
The USD/CAD currency pair retains an ambiguous technical pattern. The trading instrument is in a flat. Investors expect additional drivers. The local support and resistance levels are still 1.32150 and 1.32500, respectively. We recommend paying attention to the dynamics of oil prices. Open positions from key levels.
The Canadian Economic News Feed for 11.12.2019 is calm. Pay attention to the US News Feed
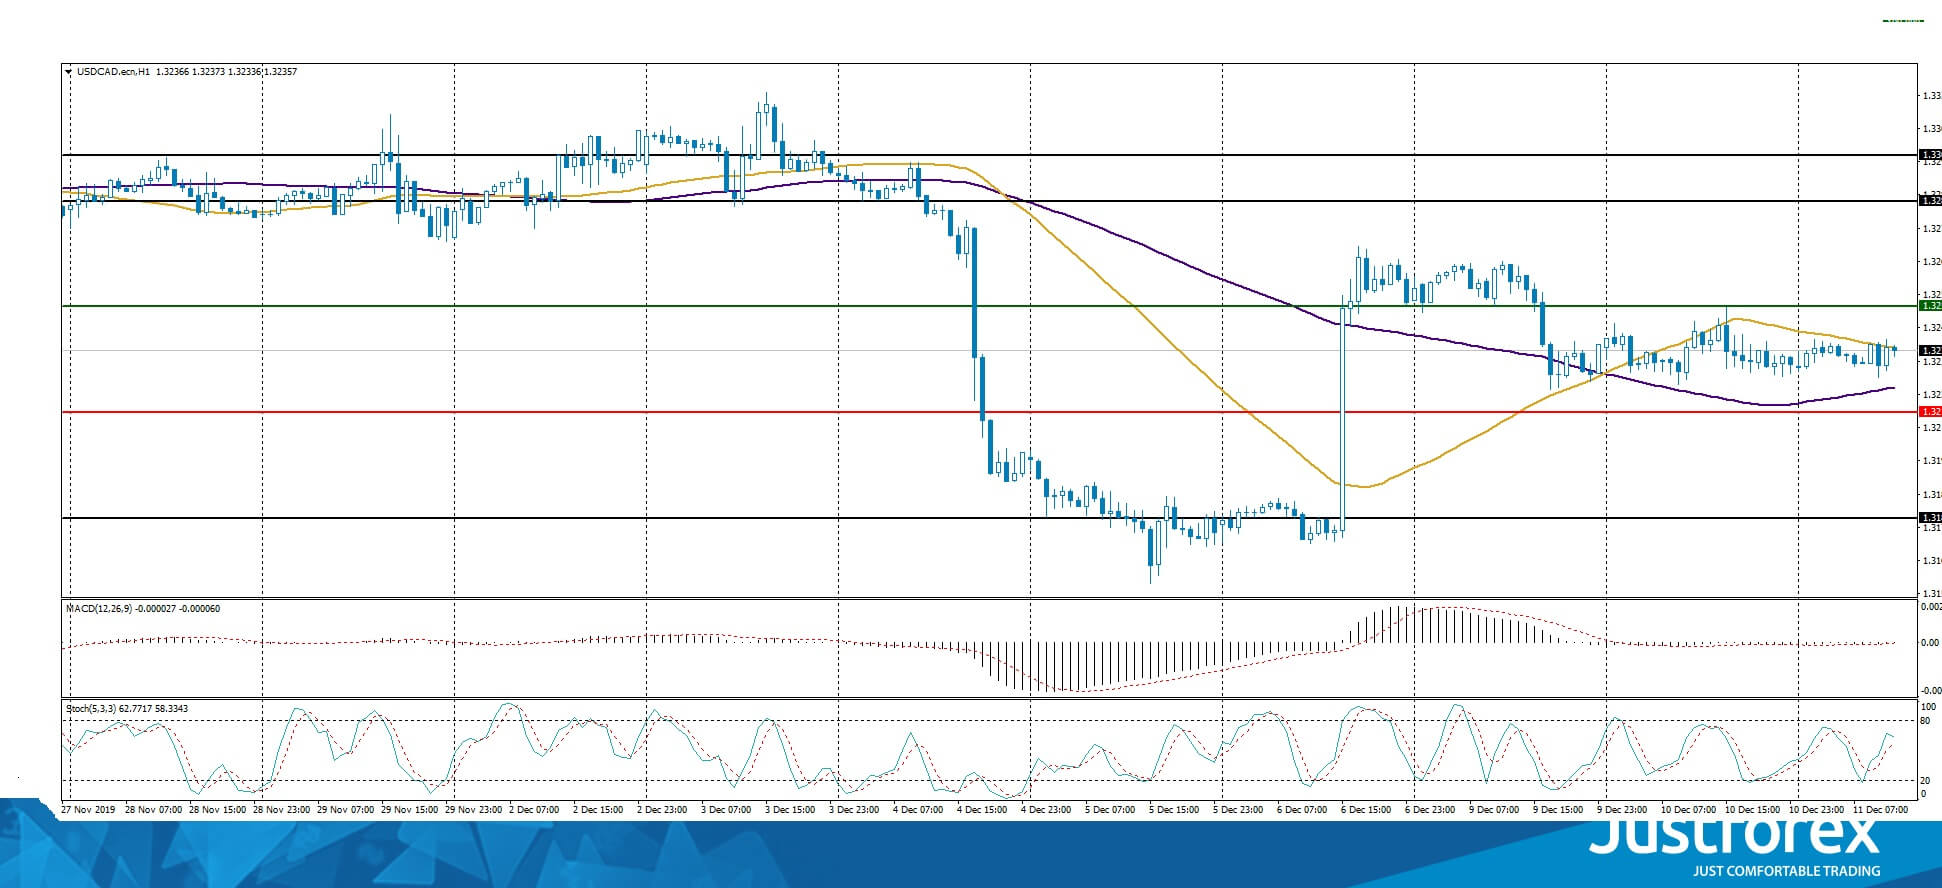
Indicators do not give accurate signals: the price has crossed 50 MA.
The MACD histogram is near the 0 mark, there are no signals.
The Stochastic Oscillator is in the neutral zone, the %K line is above the %D line, which also gives a signal to buy USD/CAD.
Trading recommendations
Support levels: 1.32150, 1.31800, 1.31500
Resistance levels: 1.32500, 1.32850
If the price consolidates above 1.32500, expect the quotes to rise 1.32850-1.33000.
Alternatively, the quotes could descend toward 1.31800-1.31650.
The USD/JPY currency pair
Technical indicators of the currency pair:
Prev Open: 108.553
Open: 108.716
% chg. over the last day: +0.19
Day’s range: 108.698 – 108.716
52 wk range: 104.97 – 114.56
The USD/JPY quotes slightly rose yesterday. Currently, the key support and resistance levels are 108.600 and 108.800, respectively. We recommend that you pay attention to the dynamics of yield on US government bonds. Open positions from key levels and pay attention to the US news background.
The Economic News Feed for 11.12.2019 is calm.
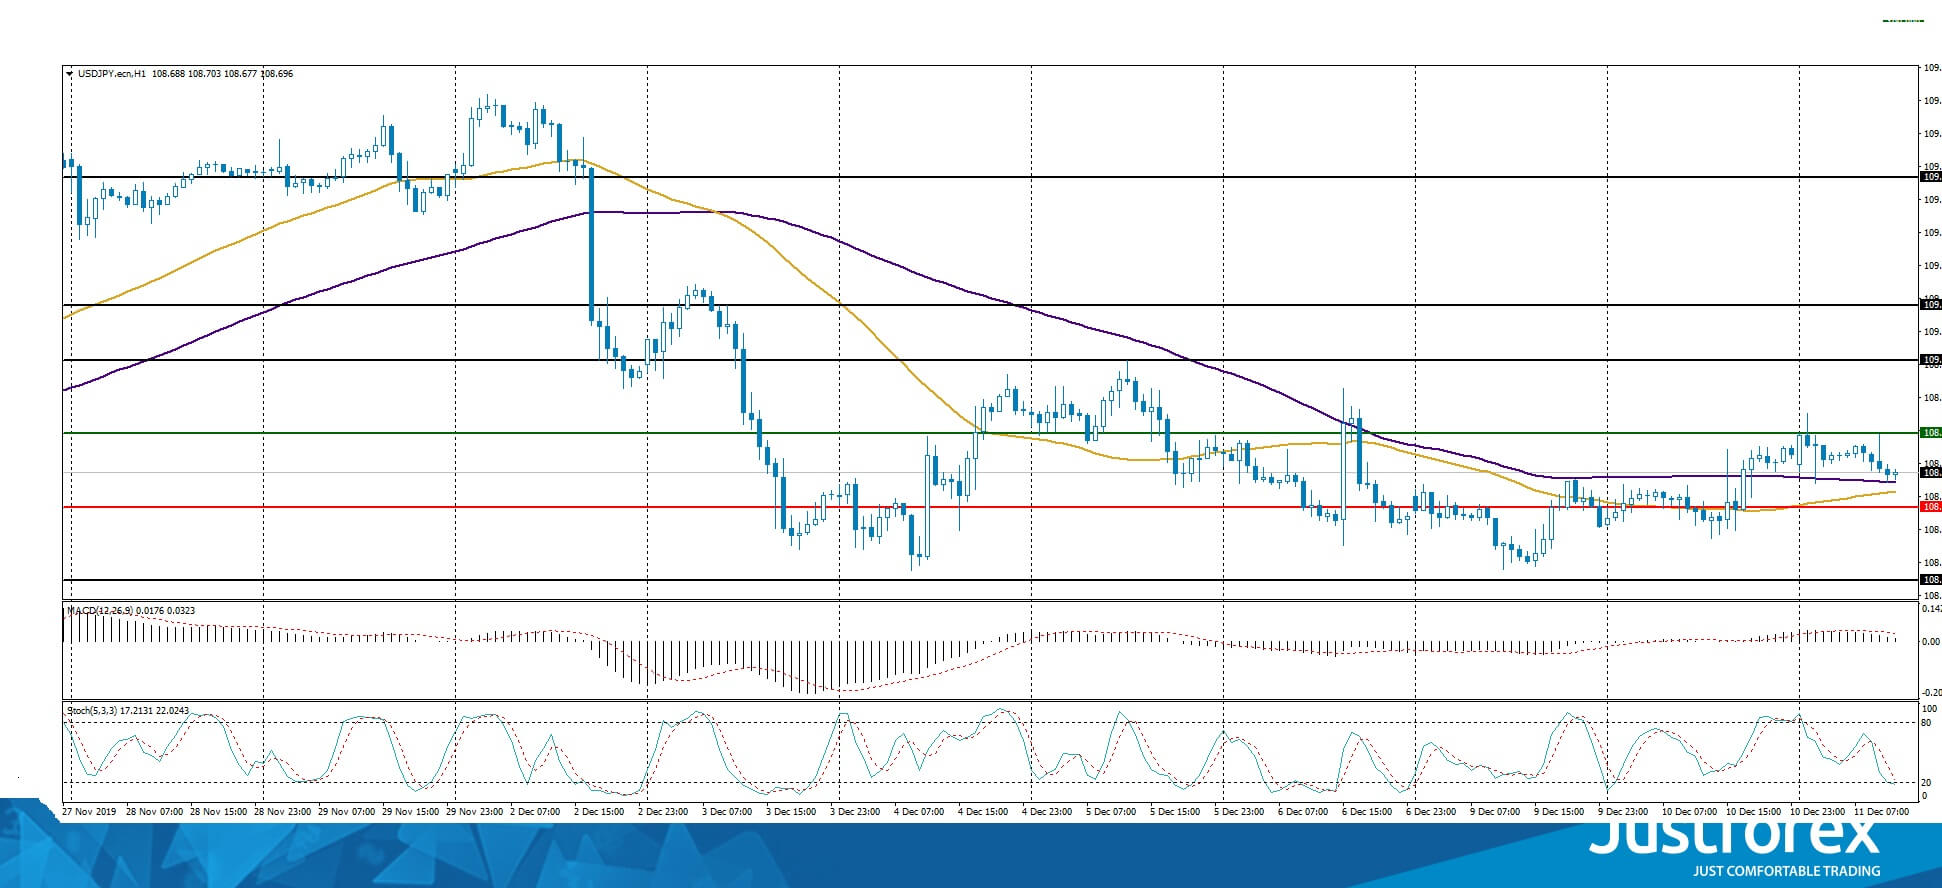
Indicators do not give accurate signals: the price is crossing 100 MA.
The MACD histogram is in the positive zone, but below the signal line, which gives a weak signal to buy USD/JPY.
The Stochastic Oscillator is in the oversold zone, the %K line is below the %D line, which indicates a bearish sentiment.
Trading recommendations
Support levels: 108.600, 108.400
Resistance levels: 108.800, 109.00
If the price consolidates above 108.800, expect further growth toward 109.000.
Alternatively, the quotes could descend toward 108.400-108.200.


