
The EUR/USD currency pair
Technical indicators of the currency pair:
Prev Open: 1.11953
Open: 1.11510
% chg. over the last day: -0.37
Day’s range: 1.11441 – 1.11683
52 wk range: 1.0879 – 1.1572
The EUR/USD currency pair is dominated by bearish sentiment. During yesterday’s trading, the drop in quotes exceeded 50 points. The trading instrument is currently consolidating. The local support and resistance levels are 1.11350 and 1.11650, respectively. We do not exclude a further decline in the EUR/USD currency pair. In December, the ISM U.S. Purchasing Managers Index accelerated from 53.9 to 55.0. Financial market participants continue to monitor developments in the Middle East. We recommend opening positions from key levels.
At 15:15 (GMT+2:00) the US will publish a report on the number of employees in the non-agricultural sector by ADP.
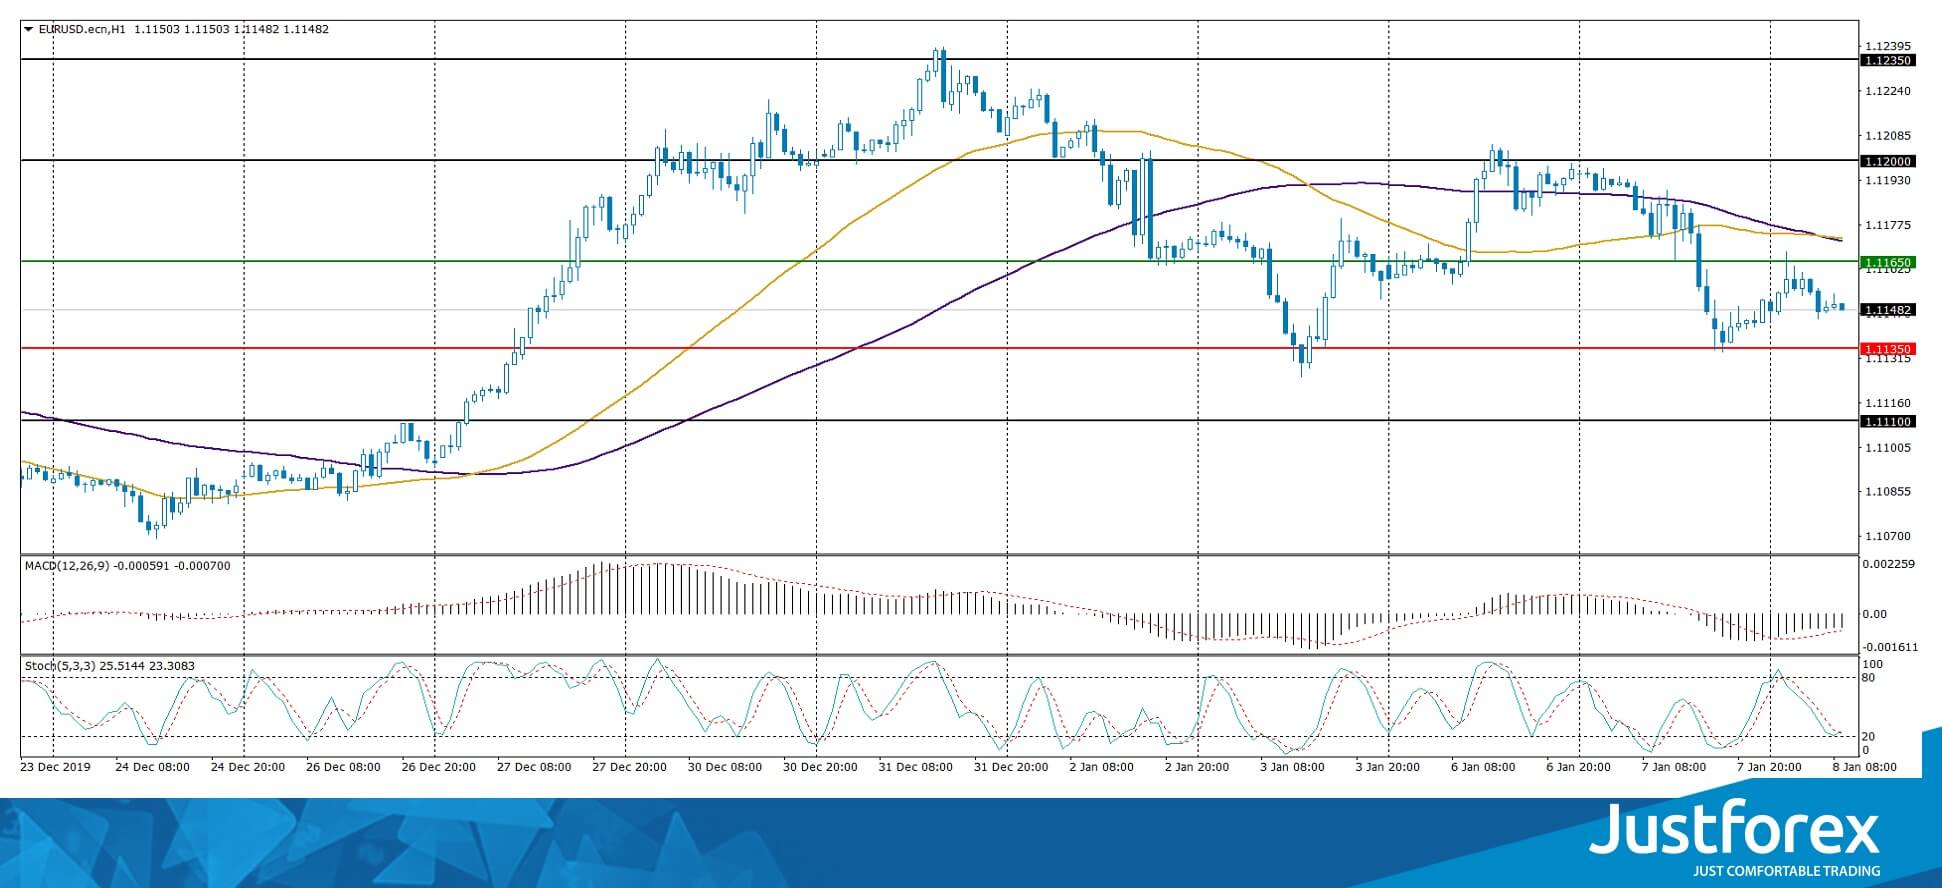
The price has fixed below 100 MA, which signals the strength of sellers.
The MACD histogram is in the negative zone and continues to decline, which sends a strong signal to sell EUR/USD.
The Stochastic Oscillator is near the oversold zone, the %K line has crossed the %D line. There are no signals at the moment.
Trading recommendations
Support levels: 1.11350, 1.11100
Resistance levels: 1.11650, 1.12000, 1.12350
If the price consolidates below 1.11350, expect a further drop to 1.11000-1.10800.
Alternatively the quotes could grow to a round level of 1.12000.
The GBP/USD currency pair
Technical indicators of the currency pair:
Prev Open: 1.31683
Open: 1.31194
% chg. over the last day: -0.42
Day’s range: 1.31044 – 1.31471
52 wk range: 1.1959 – 1.3516
An ambiguous technical pattern has developed on the GBP/USD currency pair. The trading instrument is in lateral movement. There is no defined trend. The pound is testing local support and resistance levels 1.31000 and 1.31600, respectively. Expect up-to-date information on Brexit. Open positions from key levels.
Today, the news background on the UK economy is quite calm.
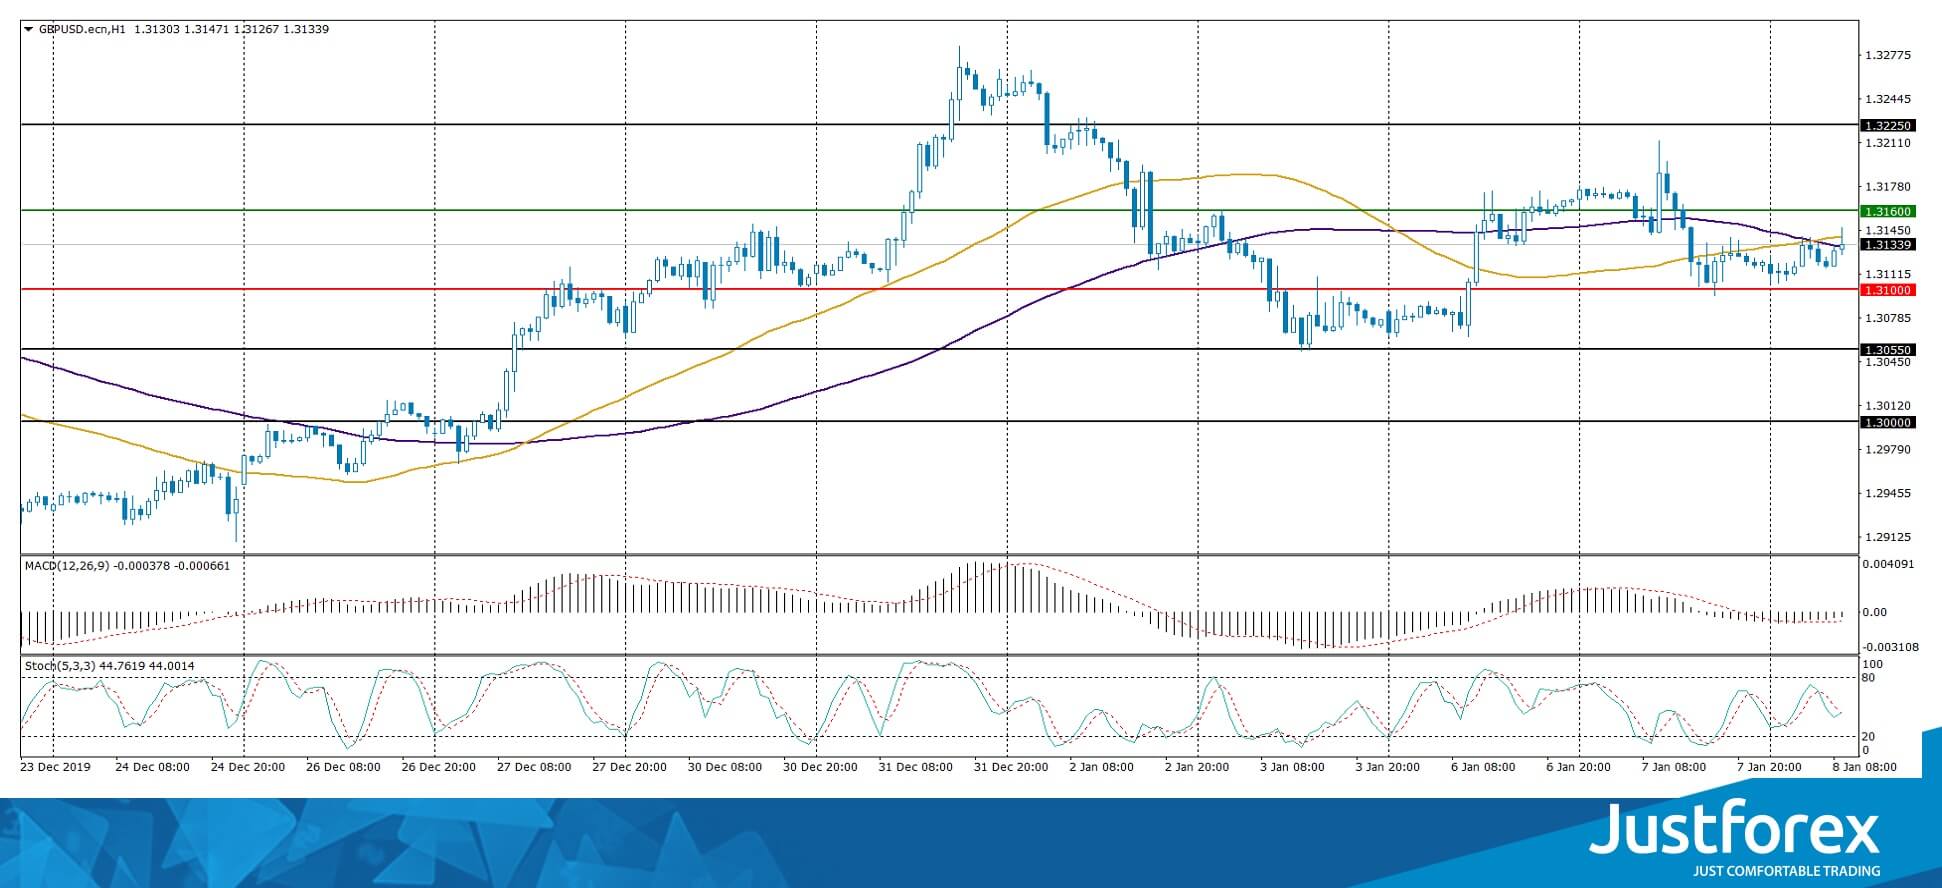
Indicators do not give accurate signals: the price has crossed 50 MA and 100 MA.
The MACD histogram is in the negative zone but above the signal line, which gives a weak signal to sell GBP/USD.
The Stochastic Oscillator is in the neutral zone, the %K line has crossed the %D line. There are no signals at the moment.
Trading recommendations
Support levels: 1.31000, 1.30550, 1.30000
Resistance levels: 1.31600, 1.32250
If the price consolidates below the round level of 1.31000, expect the quotes to fall toward 1.30600-1.30400.
Alternatively, the quotes could grow toward 1.32000-1.32300.
The USD/CAD currency pair
Technical indicators of the currency pair:
Prev Open: 1.29658
Open: 1.29851
% chg. over the last day: +0.25
Day’s range: 1.29802 – 1.30072
52 wk range: 1.2949 – 1.3566
The USD/CAD currency pair continues to consolidate after a long fall. There is no defined trend. The local support and resistance levels are 1.29600 and 1.30000, respectively. In the near future, technical correction of the trading instrument is not ruled out. In December, the Canadian business activity index from Ivey slowed from 60.0 to 51.9. We recommend that you pay attention to the dynamics of prices for oil. Open positions from key levels.
The news background on the Canadian economy is calm.
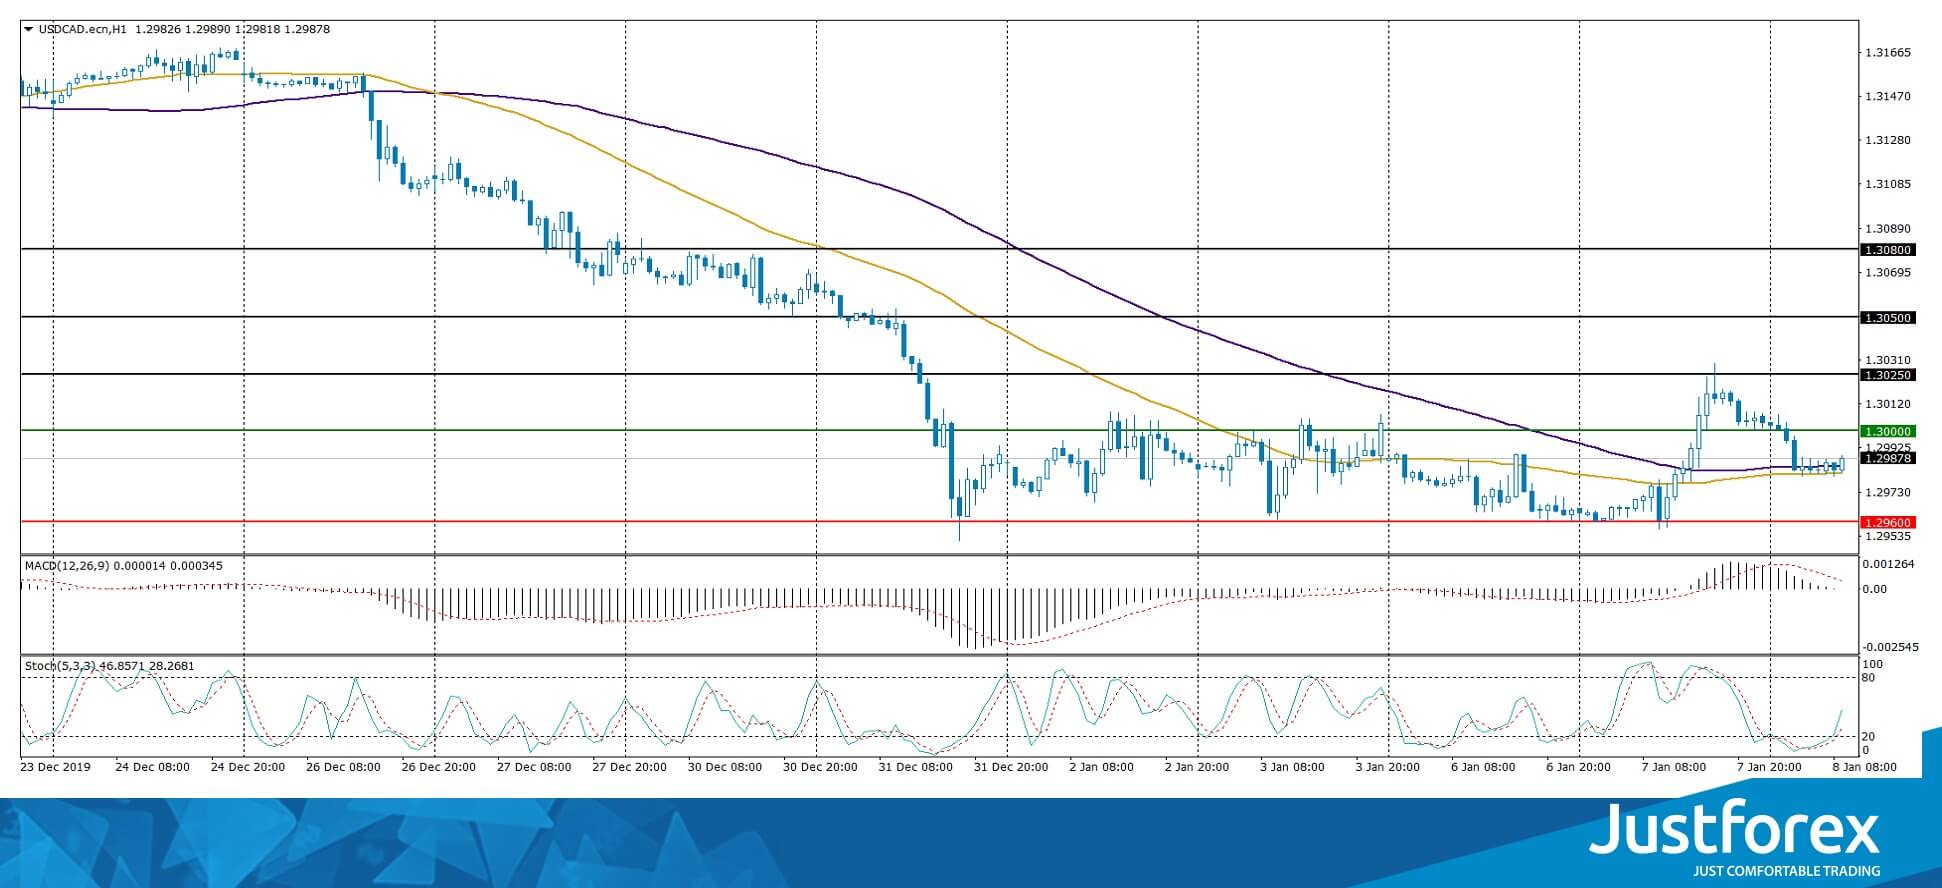
Indicators do not give accurate signals: the price has crossed 50 MA and 100 MA.
The MACD histogram is near the 0 mark. There are no signals at the moment.
Stochastic Oscillator is in the neutral zone, the %K line is above the %D line, which indicates bullish sentiment.
Trading recommendations
Support levels: 1.29600, 1.29200
Resistance levels: 1.30000, 1.30250, 1.30500
If the price consolidates above the round level of 1.30000, expect a correction toward 1.30300
An alternative could be a decrease in the USD/CAD currency pair to 1.29400-1.29200.
The USD/JPY currency pair
Technical indicators of the currency pair:
Prev Open: 108.327
Open: 108.447
% chg. over the last day: +0.07
Day’s range: 107.651 – 108.513
52 wk range: 104.45 – 113.53
Since the beginning of this week, trading on the USD/JPY currency pair has been very active. The focus is on geopolitical tensions in the Middle East. Demand for “safe haven” currencies remains at a fairly high level. At the moment, the following local support and resistance levels can be distinguished: 108.150 and 108.600, respectively. We recommend that you pay attention to the dynamics of yield on US government bonds. Open positions from key levels.
The news background on the Japanese economy is calm.
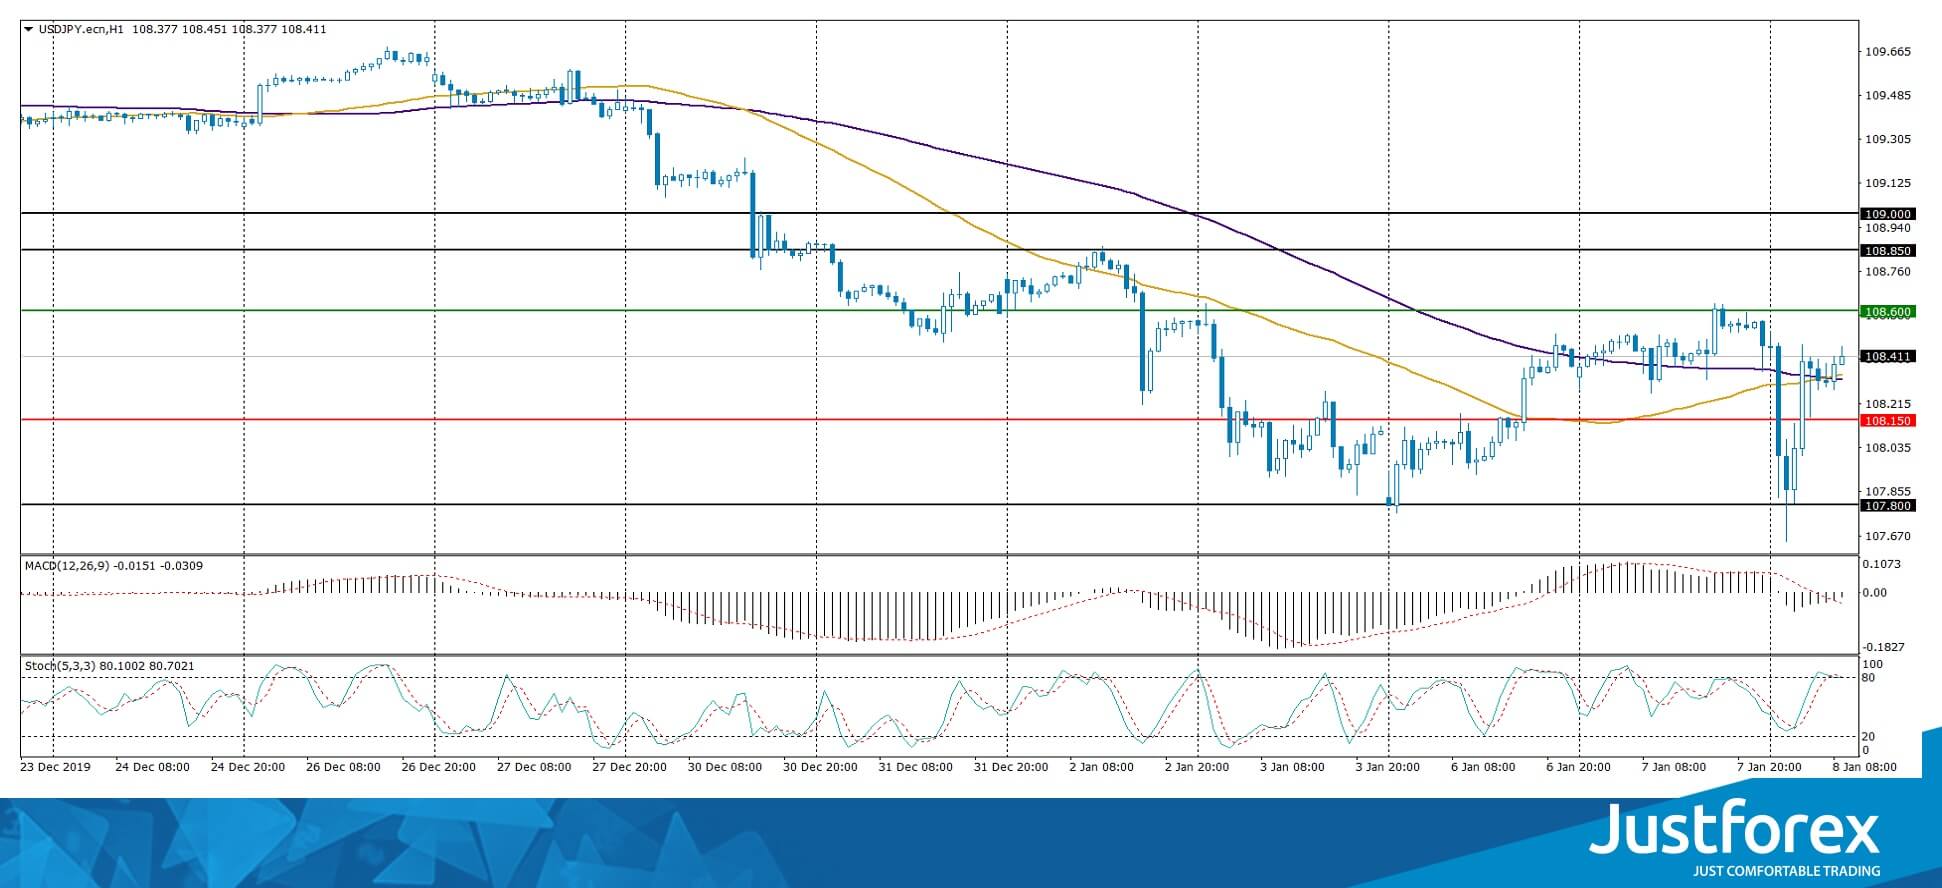
Indicators do not give accurate signals: the price has crossed 50 MA and 100 MA.
The MACD histogram has approached the 0 mark. There are no signals at the moment.
The Stochastic Oscillator is near the overbought zone, the %K line has crossed the %D line. There are no signals at the moment.
Trading recommendations
Support levels: 108.150, 107.800
Resistance levels: 108.600, 108.850, 109.000
If the price consolidates below 108.150, expect the quotes to fall toward 107.800-107.600.
Alternatively, the quotes could grow toward 109.000.


