HomeContributorsTechnical AnalysisElliott Wave View: Oil ($CL_F) Decline In Impulsive Structure

Elliott Wave View: Oil ($CL_F) Decline In Impulsive Structure

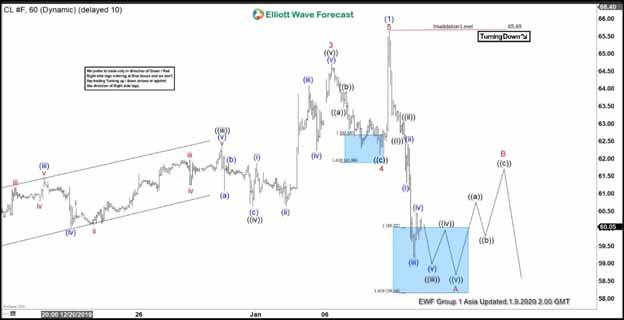
Elliott Wave view on Crude Oil ($CL_F) suggests rally to $65.69 on January 8, 2020 ended wave (1). This ended a 5 waves rally from October 3, 2019 low. Oil is now doing wave (2) pullback to correct the cycle from October 3, 2019 low before the rally resumes. The decline is unfolding as a zigzag Elliott Wave structure where the first leg of the zigzag wave A remains in progress. Down from $65.69, wave ((i)) ended at $62.73 and wave ((ii)) bounce ended at $63.07.

Oil has resumed lower within wave ((iii)) with subdivision as another 5 waves in lesser degree. Another leg lower can be seen before wave ((iii)) ends, then it should bounce in wave ((iv)) before the another leg in wave ((v)) lower to complete wave A. Oil should then bounce in wave B to correct cycle from January 8, 2020 high before turning lower again in wave C. As far as pivot at $65.69 high stays intact in the bounce, expect rally to fail in the sequence of 3, 7, or 11 swing for further downside.

$CL_F 1 Hour Elliott Wave Chart

Elliott Wave Forecast
Elliott Wave Forecasthttps://elliottwave-forecast.com
ElliottWave-Forecast has built its reputation on accurate technical analysis and a winning attitude. By successfully incorporating the Elliott Wave Theory with Market Correlation, Cycles, Proprietary Pivot System, we provide precise forecasts with up-to-date analysis for 52 instruments including Forex majors & crosses, Commodities and a number of Equity Indices from around the World. Our clients also have immediate access to our proprietary Actionable Trade Setups, Market Overview, 1 Hour, 4 Hour, Daily & Weekly Wave Counts. Weekend Webinar, Live Screen Sharing Sessions, Daily Technical Videos, Elliott Wave Setup videos, Educational Resources, and 24 Hour chat room where they are provided live updates and given answers to their questions.

Featured Analysis

Learn Forex Trading