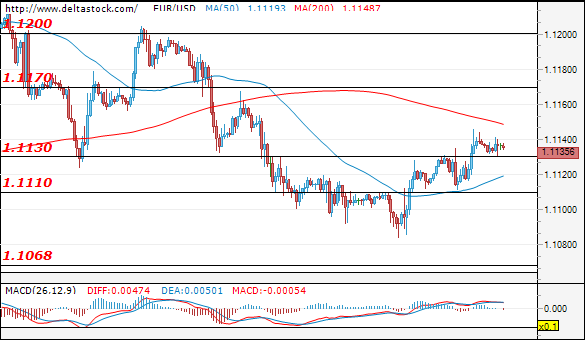
EUR/USD
Current level – 1.1135
After the successful breakthrough of the resistance level at 1.1130, the currency pair is expected to aim for higher levels within the next few trading sessions. A test of the resistance levels around 1.1170 and 1.1200 will remain the more probable scenario. On the negative side, if sellers regain control and the support at 1.1100 is violated, the price will likely decrease to the major support around 1.1068. Volatility and important movements can be expected around the US Core CPI today (13:30 GMT).
| Resistance | Support | ||
| intraday | intraweek | intraday | intraweek |
| 1.1170 | 1.1200 | 1.1130 | 1.1068 |
| 1.1200 | 1.1300 | 1.1110 | 1.1000 |
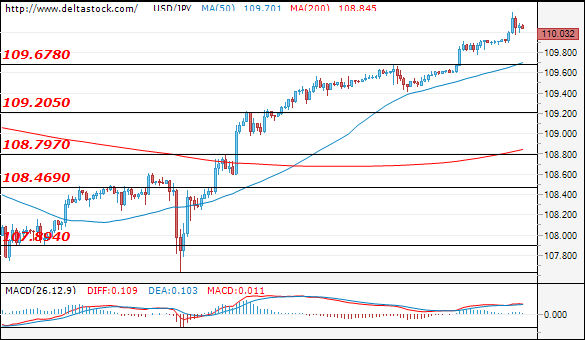
USD/JPY
Current level – 110.03
After the important resistance at 109.68 didn’t hold and the price successfully reached levels around 110.00, the currency pair is now expected to aim for the highs from the start of 2019. The de-escalation of the conflict in the MiddleEast and the successful signing of the phase one of the US-China trade deal are the main factors for the short-term movement. If the momentum decreases, first important support lies at 109.68, followed by the zones at around 109.20 and 108.80.
| Resistance | Support | ||
| intraday | intraweek | intraday | intraweek |
| 110.20 | 110.50 | 109.68 | 108.80 |
| 110.50 | 111.00 | 109.20 | 107.90 |
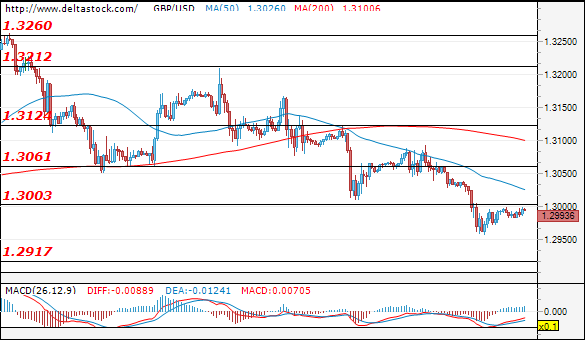
GBP/USD
Current level – 1.2993
The GBP managed to break through the support level at 1.30 and the sentiment on the market remains slightly negative. A test of the support zone at 1.2917 is now highly likely if the price remains below 1.30. A breach of the aforementioned support level should increase the downward momentum and pave the way towards the next important level of support at around 1.2790. However, if the buyers could push the Cable above 1.3124, the sentiment would likely change, which may lead to a movement towards the resistance at 1.3210.
| Resistance | Support | ||
| intraday | intraweek | intraday | intraweek |
| 1.3000 | 1.3125 | 1.2950 | 1.2915 |
| 1.3061 | 1.3210 | 1.2915 | 1.2790 |