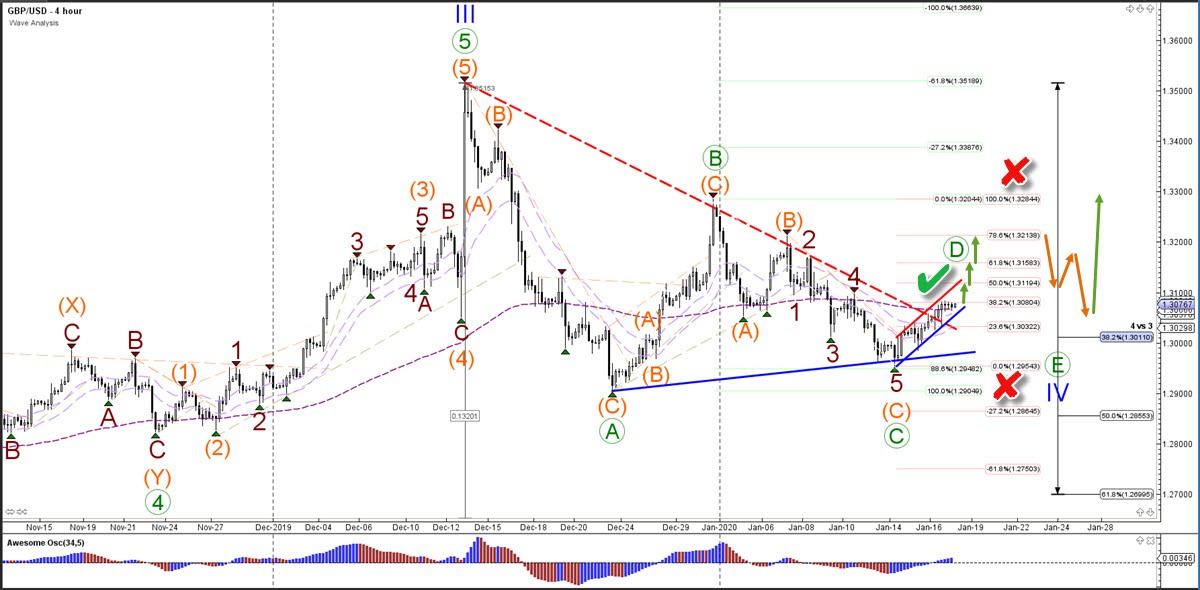
The GBP/USD bullish price swing could be part of a larger ABCDE (green) triangle pattern. The current bullish swing is likely a wave D (green) as long as the price stays below the top of 1.3280 or above the bottom of 1.2950 (red x). A bullish breakout (green check) above the 38.2% Fibonacci level could indicate a move higher towards the Fibonacci targets.
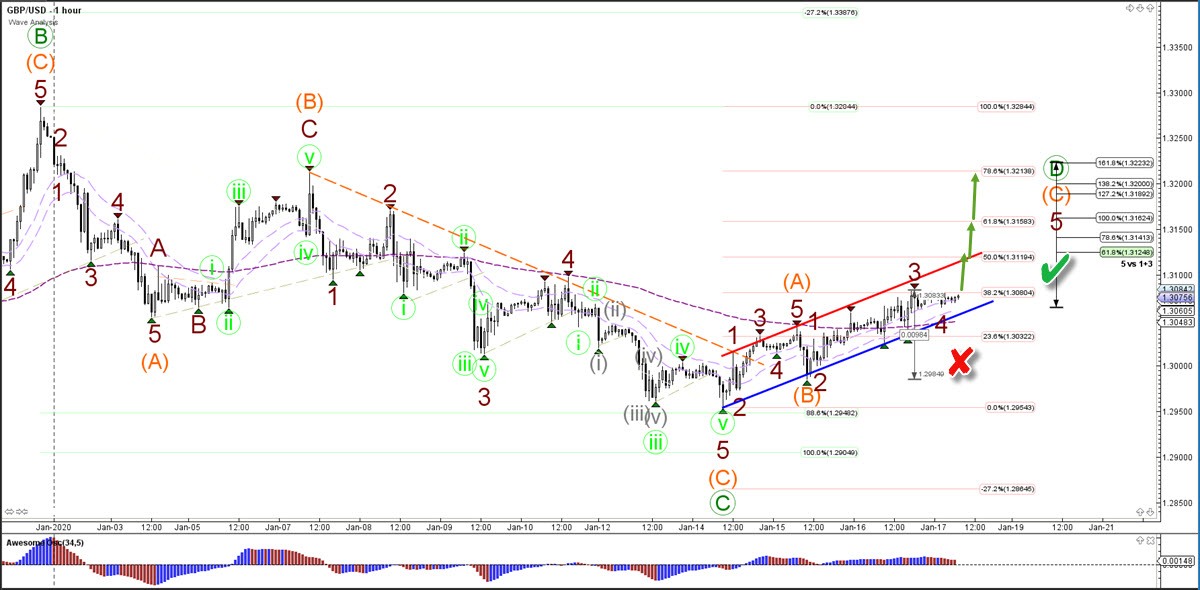
The GBP/USD is building a 5 wave (dark red) within a potential wave C (orange). The bullish breakout above the 38.2% Fib could confirm the continuation whereas a break below the 1.30 support zone could indicate the end of the ABC (orange) pattern and a bearish breakout.