
The EUR/USD currency pair
Technical indicators of the currency pair:
Prev Open: 1.10084
Open: 1.10317
% chg. over the last day: +0.16
Day’s range: 1.10170 – 1.10351
52 wk range: 1.0879 – 1.1572
The EUR/USD currency pair has moved up after a prolonged decline. The trading instrument has updated its local highs. At the moment EUR/USD quotes are consolidated in the range of 1.10100-1.10400. The technical picture signals a further correction of the single currency against the USD. Investors continue to assess the risks of further coronavirus spreading. We expect the release of important statistical data. We recommend opening positions from key levels.
The Economic News Feed for 31.01.2020:
Consumer Price Index (EU) – 12:00 (GMT+2:00);
GDP Report (EU) – 12:00 (GMT+2:00);
Personal Spending (US) – 15:30 (GMT+2:00);
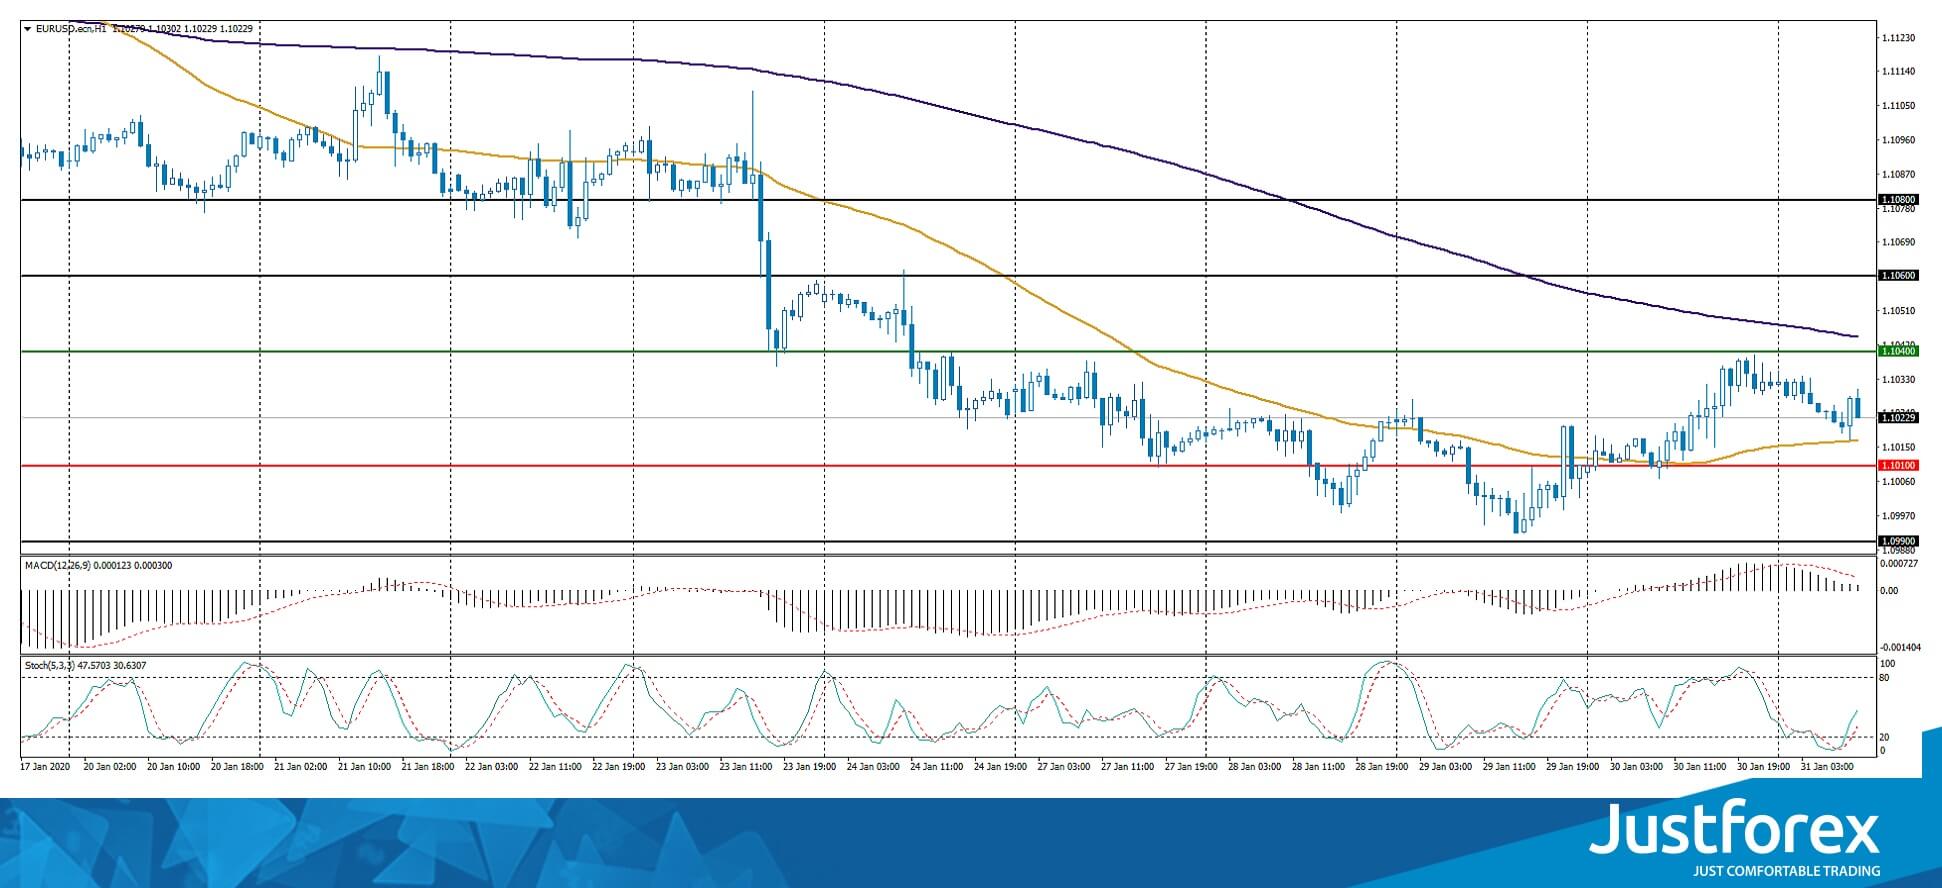
Indicators do not give accurate signals: the price has fixed between 50 MA and 100 MA.
The MACD histogram is in the positive zone, but below the signal line, which gives a weak signal to buy EUR/USD.
The Stochastic Oscillator is in the neutral zone, the %K line is above the %D line, which indicates a bullish mood.
Trading recommendations
Support levels: 1.10100, 1.09900
Resistance levels: 1.10400, 1.10600, 1.10800
If the price fixes above 1.10400, expect the quotes to correct toward 1.10600-1.10800.
Alternatively, the quotes could descend toward 1.09900-1.09700.
The GBP/USD currency pair
Technical indicators of the currency pair:
Prev Open: 1.30186
Open: 1.30856
% chg. over the last day: +0.50
Day’s range: 1.30814 – 1.31407
52 wk range: 1.1959 – 1.3516
GBP/USD quotes are showing positive dynamics. During yesterday and today’s trading the sterling strengthened against the US dollar by more than 100 points. The Bank of England, as expected, kept the main parameters of monetary policy at the same level. Today the UK will officially withdraw from the EU. At the moment, the trading instrument is consolidated in the range of 1.31000-1.31400. You should open positions from these marks.
Publication of important economic reports from the UK is not planned.
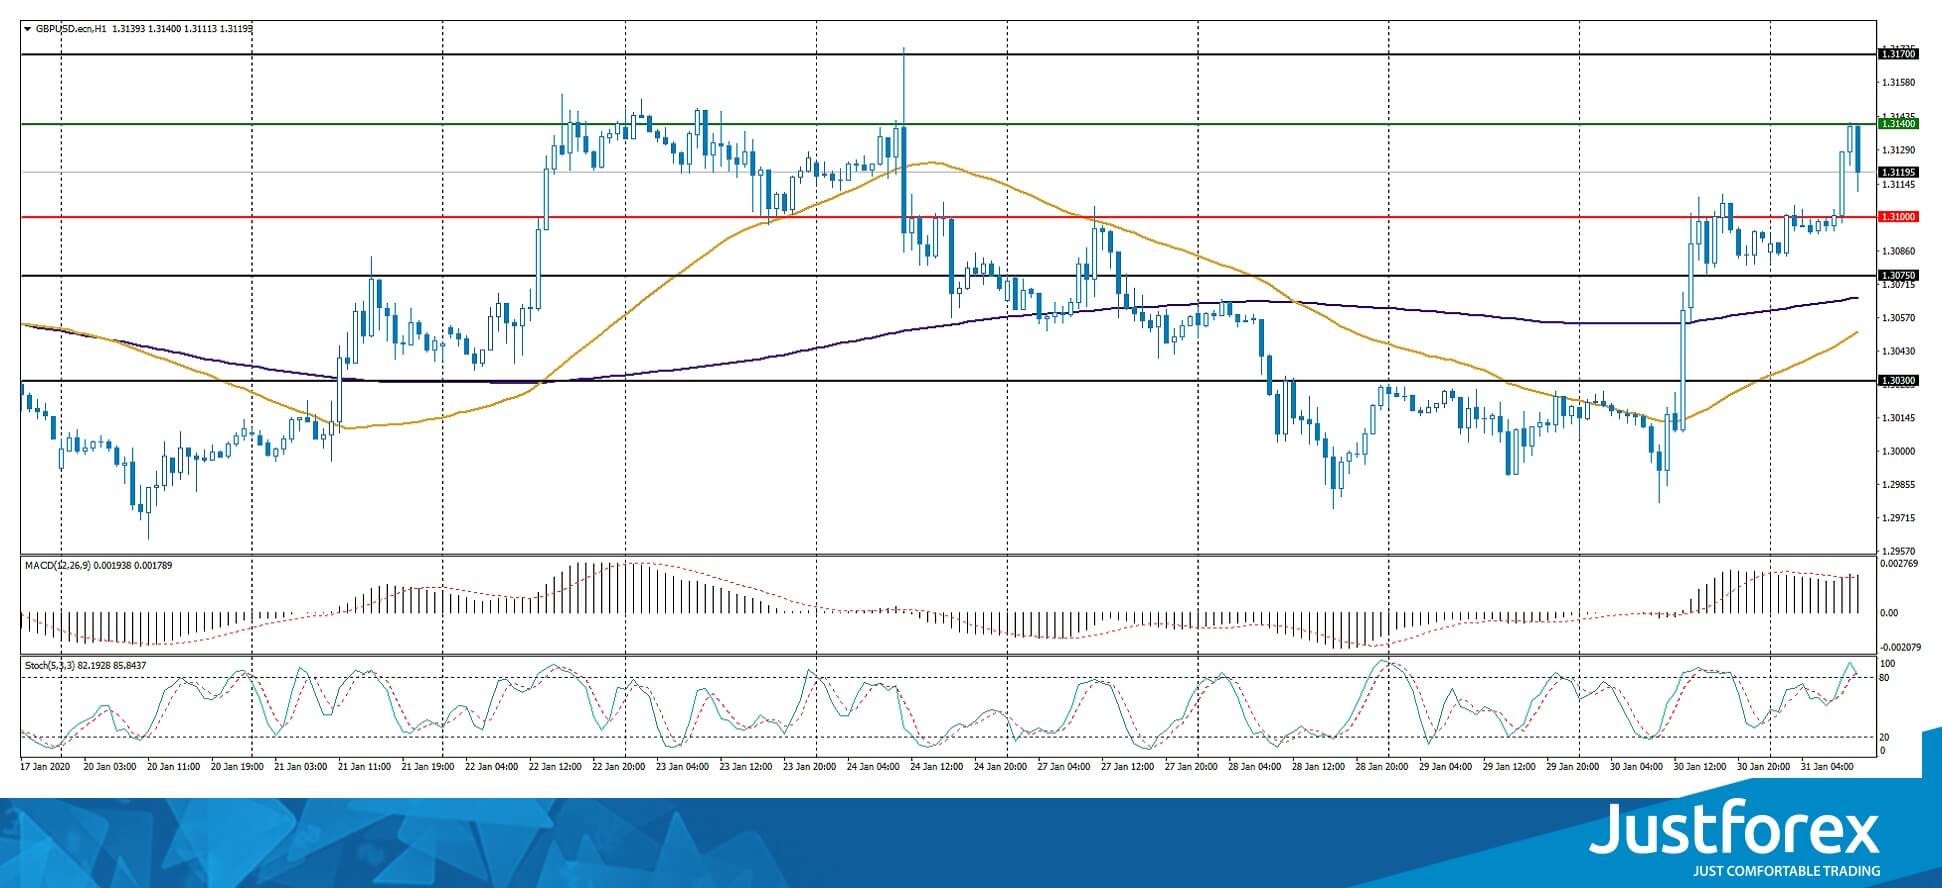
The indicators signal the strength of buyers: the price has fixed above 50 MA and 100 MA.
Histogram of MACD is in the positive zone, which indicates a bullish sentiment.
The Stochastic Oscillator is located in the overbought zone, the %K line crossed the %D line. No signals at the moment.
Trading recommendations
Support levels: 1.31000, 1.30750, 1.30300
Resistance levels: 1.31400, 1.31700
If the price fixes above 1.31400, expect the quotes to rise toward 1.31700-1.32000.
Alternatively, the quotes could descend toward 1.30700-1.30500.
The USD/CAD currency pair
Technical indicators of the currency pair:
Prev Open: 1.31974
Open: 1.32042
% chg. over the last day: +0.08
Day’s range: 1.31952 – 1.32339
52 wk range: 1.2949 – 1.3566
The USD/CAD currency pair is still dominated by bullish sentiments. The trading instrument has updated local highs again. At the moment USD/CAD quotes are testing resistance level 1.32350. The mark 1.31900 is a key support. Technical correction is not ruled out in the nearest future. Today participants of financial markets will evaluate important economic releases from Canada. Positions should be opened from key levels.
At 15:30 (GMT+2:00) a report on Canadian GDP will be published.
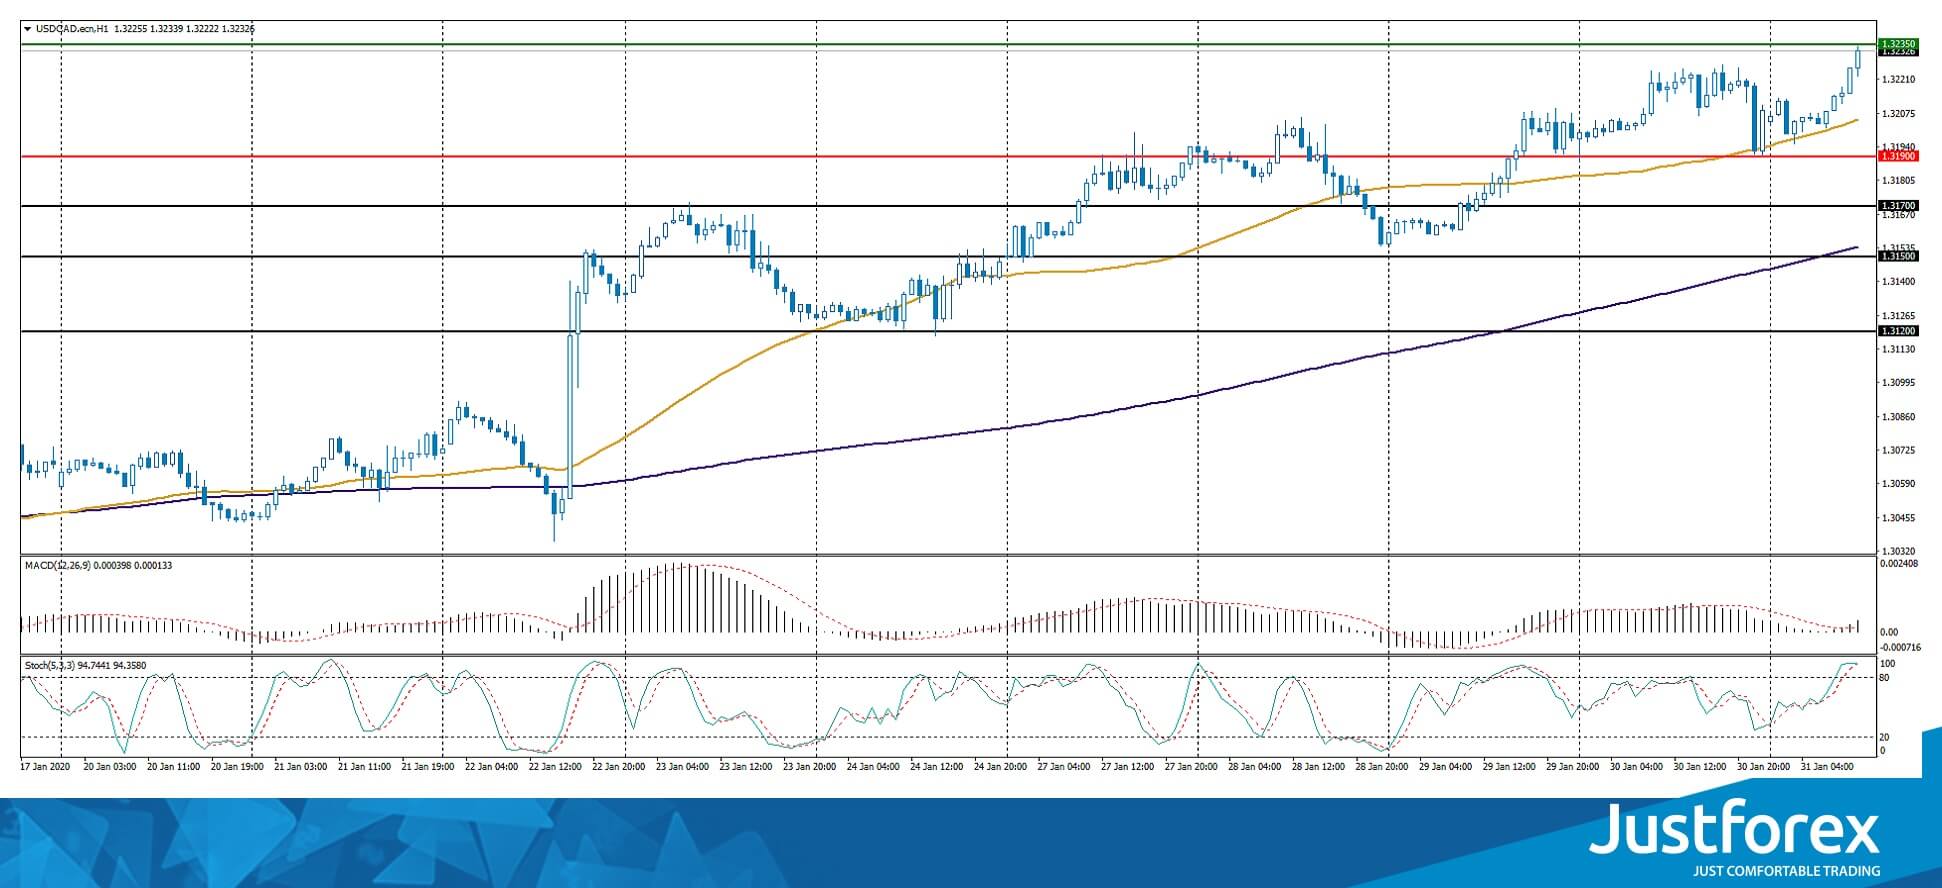
The indicators signal the strength of buyers: the price has fixed above 50 MA and 100 MA.
MACD histogram is in the positive zone, which indicates a bullish sentiment.
The Stochastic Oscillator is located in the overbought zone, the %K line crossed the %D line. No signals at the moment.
Trading recommendations
Support levels: 1.31900, 1.31700, 1.31500
Resistance levels: 1.32350, 1.32600
If the price fixes above 1.32350, expect further growth toward 1.32600-1.32800.
Alternatively, the quotes could correct toward 1.31600-1.31400.
The USD/JPY currency pair
Technical indicators of the currency pair:
Prev Open: 108.983
Open: 108.977
% chg. over the last day: -0.01
Day’s range: 108.878 – 109.136
52 wk range: 104.45 – 113.53
USD/JPY currency pair continues to trade in a long flat. There is no defined trend. The trading instrument tests the local supply and demand areas: 108.600-108.750 and 109.100-109.250, respectively. USD/JPY quotes have potential for recovery. We recommend you to pay attention to the dynamics of US government securities yield. Positions should be opened from key levels.
The news background on Japanese economy is rather calm.
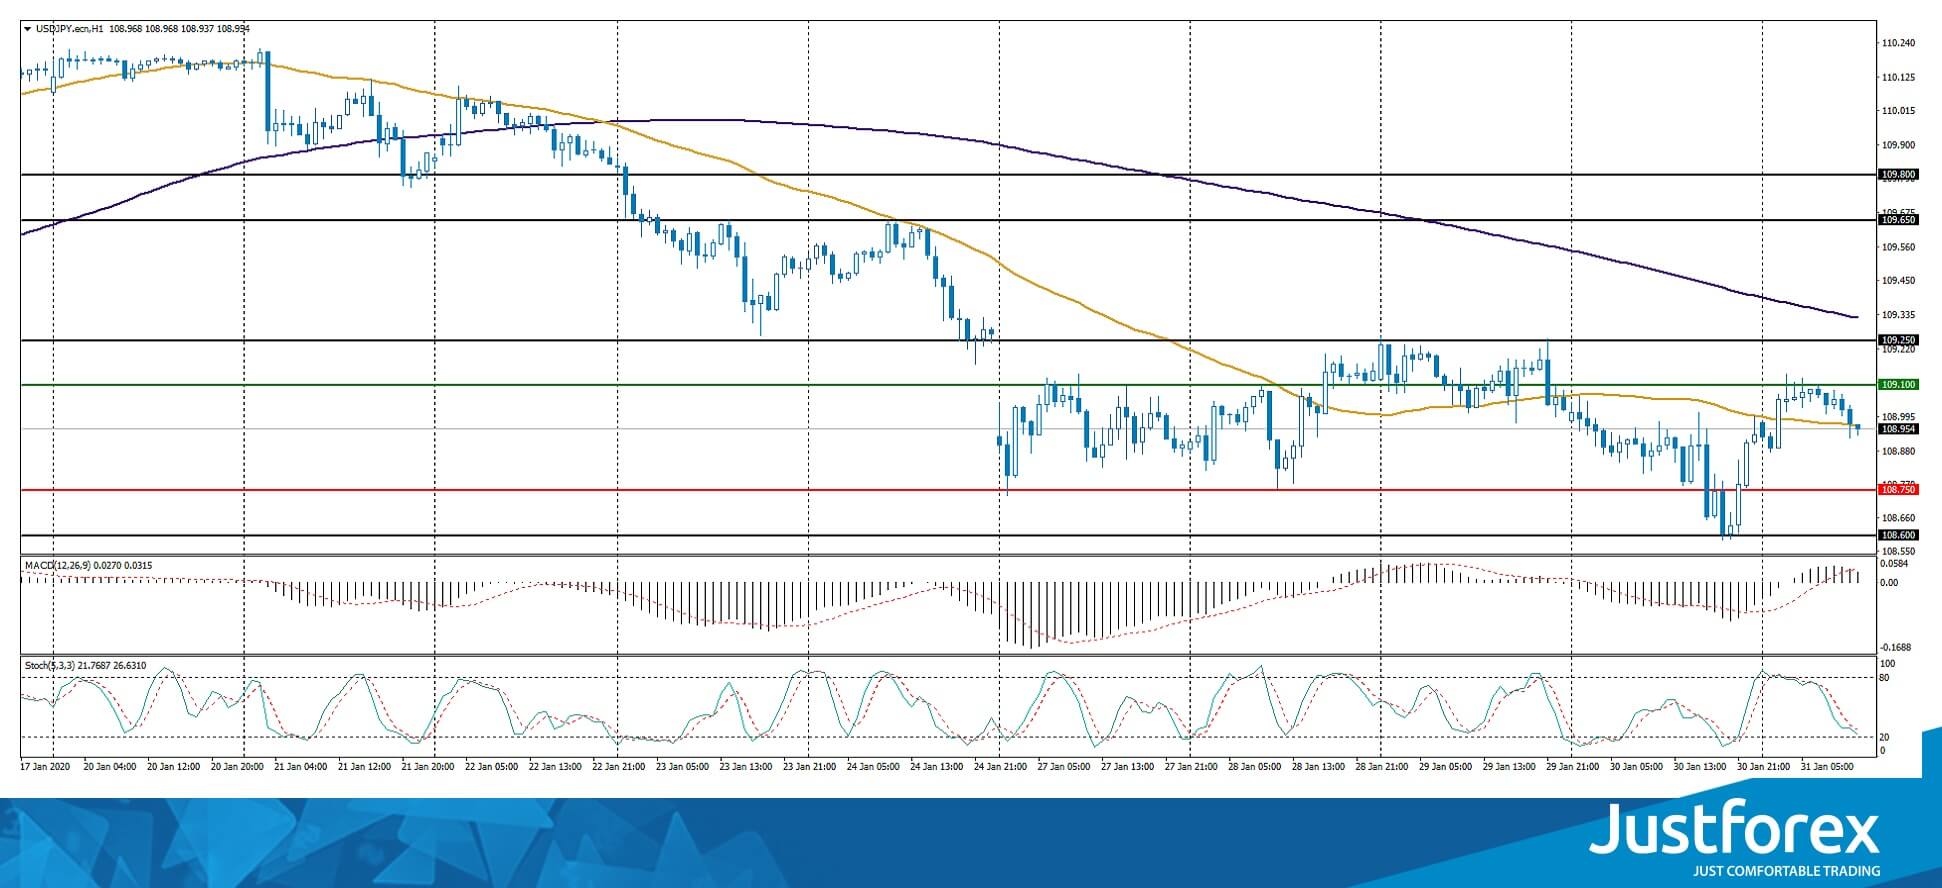
Indicators do not give accurate signals: the price has crossed 50 MA.
Histogram of MACD is in positive zone, which indicates bullish moods.
The Stochastic Oscillator is in the neutral zone, the %K line is below the %D line, which gives a sell signal for USD/JPY.
Trading recommendations
Support levels: 108.750, 108.600
Resistance levels: 109.100, 109.250, 109.650
If the price fixes above 109.100, USD/JPY quotes are expected to rise. Potential movement towards 109.400-109.600.
Alternatively, the USD/JPY pair may decline to 108.500-108.300.


