
The EUR/USD currency pair
Technical indicators of the currency pair:
Prev Open: 1.10002
Open: 1.10416
% chg. over the last day: +0.24
Day’s range: 1.10363 – 1.10738
52 wk range: 1.0879 – 1.1572
The EUR/USD currency pair is still dominated by a bullish sentiment. The quotes have updated the local highs again. The demand for USD has decreased significantly. Financial markets participants expect the Fed to reduce the range of key interest rates to 1.00-1.25% at the next meeting on March 18. At the moment the trading instrument is consolidating in the range of 1.10100-1.10700. The EUR can recover further. We are waiting for important statistical data today. Positions should be opened from key levels.
The Economic News Feed for 02.03.2020:
business activity index in German manufacturing sector – 10:55 (GMT+2:00);
ISM’s business activity index in the US manufacturing sector – 17:00 (GMT+2:00).
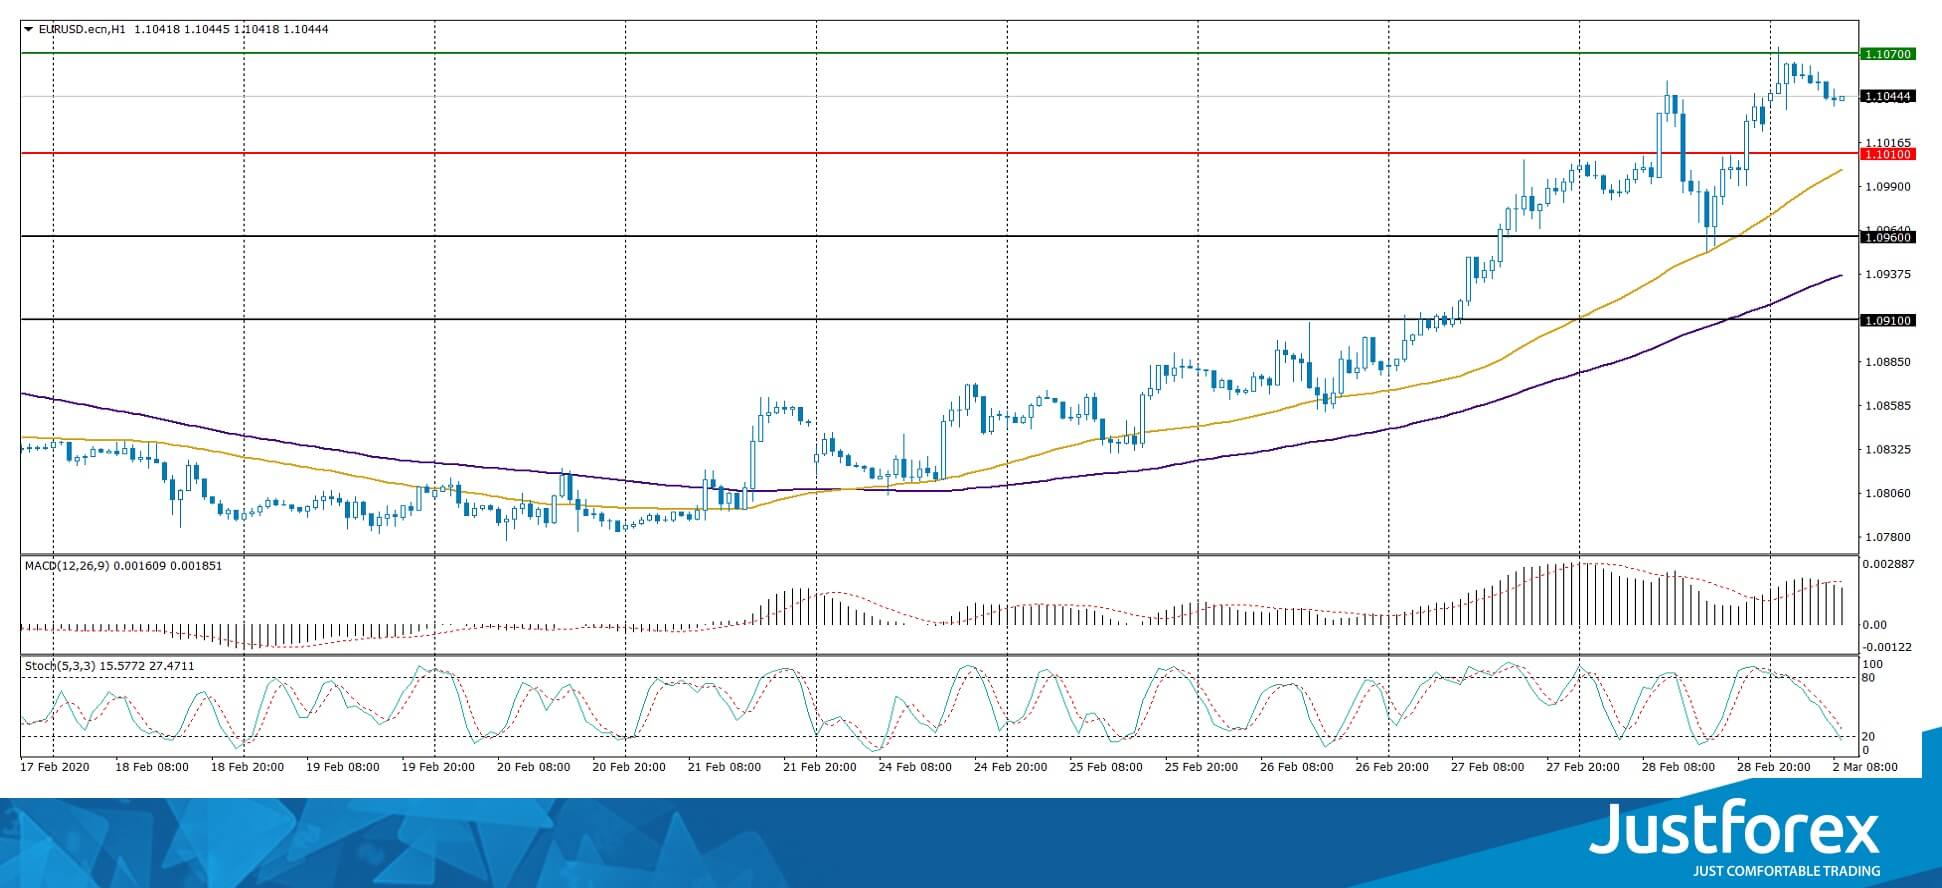
The indicators signal the strength of buyers: the price has fixed above 50 MA and 100 MA.
MACD histogram is in the positive zone, which gives a signal to buy EUR/USD.
The Stochastic Oscillator is in the neutral zone, the %K line is below the %D line, which indicates the development of a correction movement.
Trading recommendations
Support levels: 1.10100, 1.09600, 1.09100
Resistance levels: 1.10700, 1.11000
If the price fixes above 1.10700, expect further growth to 1.11000-1.11200.
Alternatively, the quotes could descend toward 1.09700-1.09500.
The GBP/USD currency pair
Technical indicators of the currency pair:
Prev Open: 1.28811
Open: 1.27878
% chg. over the last day: -0.13
Day’s range: 1.27830 – 1.28507
52 wk range: 1.1959 – 1.3516
Sales dominate on the GBP/USD currency pair. Sterling has set new key lows. At the moment, GBP/USD is consolidating near the mirror resistance at 1.28550. The round level 1.28000 is the nearest support. The trading instrument can decline further. Investors are waiting for important economic releases from the UK and USA. Positions should be opened from key levels.
At 11:30 (GMT+2:00) UK will publish an index of business activity in the manufacturing sector.
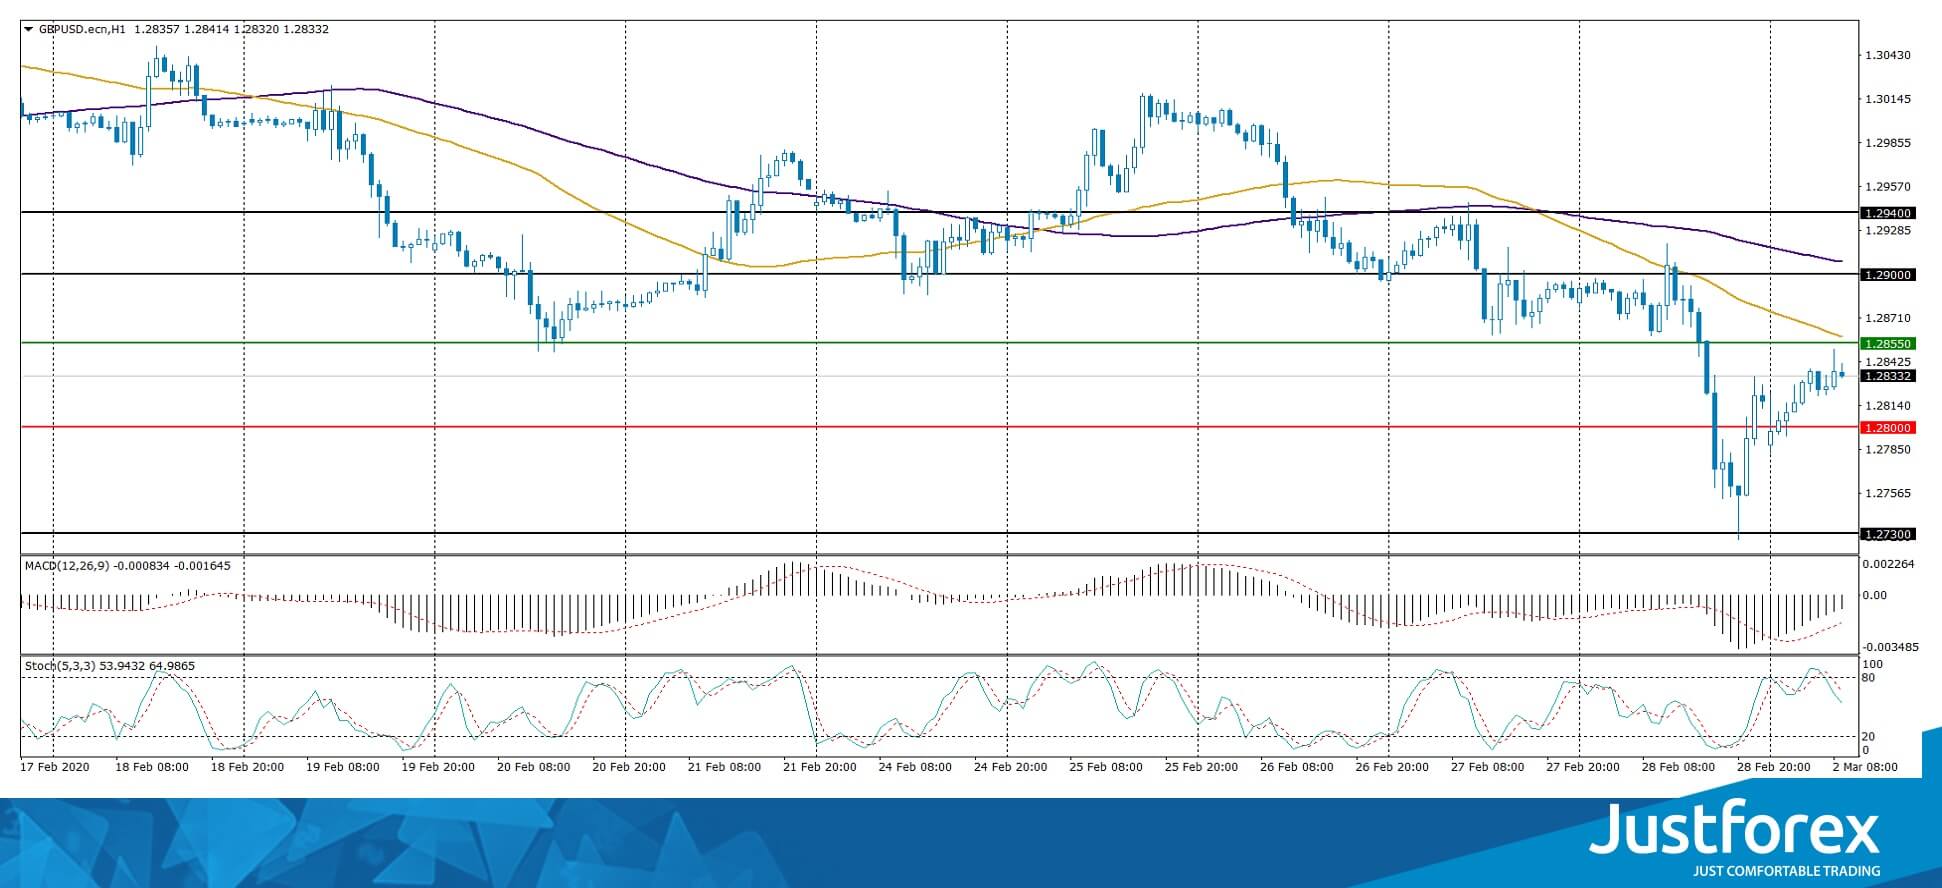
The indicators signal the sellers’ strength: the price has fixed below 50 MA and 100 MA.
The MACD histogram is in the negative zone, but above the signal line, which gives a weak signal to sell GBP/USD.
The Stochastic Oscillator is in the neutral zone, the %K line is below the %D line, which indicates a bearish sentiment.
Trading recommendations
Support levels: 1.28000, 1.27300
Resistance levels: 1.28550, 1.29000, 1.29400
If the price fixes below the round level of 1.28000, expect a descend toward 1.27500-1.27000.
Alternatively, the quotes could recover toward 1.29000-1.29400.
The USD/CAD currency pair
Technical indicators of the currency pair:
Prev Open: 1.33906
Open: 1.34332
% chg. over the last day: +0.11
Day’s range: 1.33334 – 1.34382
52 wk range: 1.2949 – 1.3566
USD/CAD quotes have moved down. The CAD has updated local lows. The Canadian dollar is supported by the oil price recovery after a prolonged decline. At the moment the trading instrument is consolidating. The key support and resistance levels are: 1.33350 and 1.33900, respectively. The USD/CAD currency pair has a potential for further correction. We recommend you to pay attention to the US economic reports. Positions should be opened from key levels.
The news background on the Canadian economy is calm.
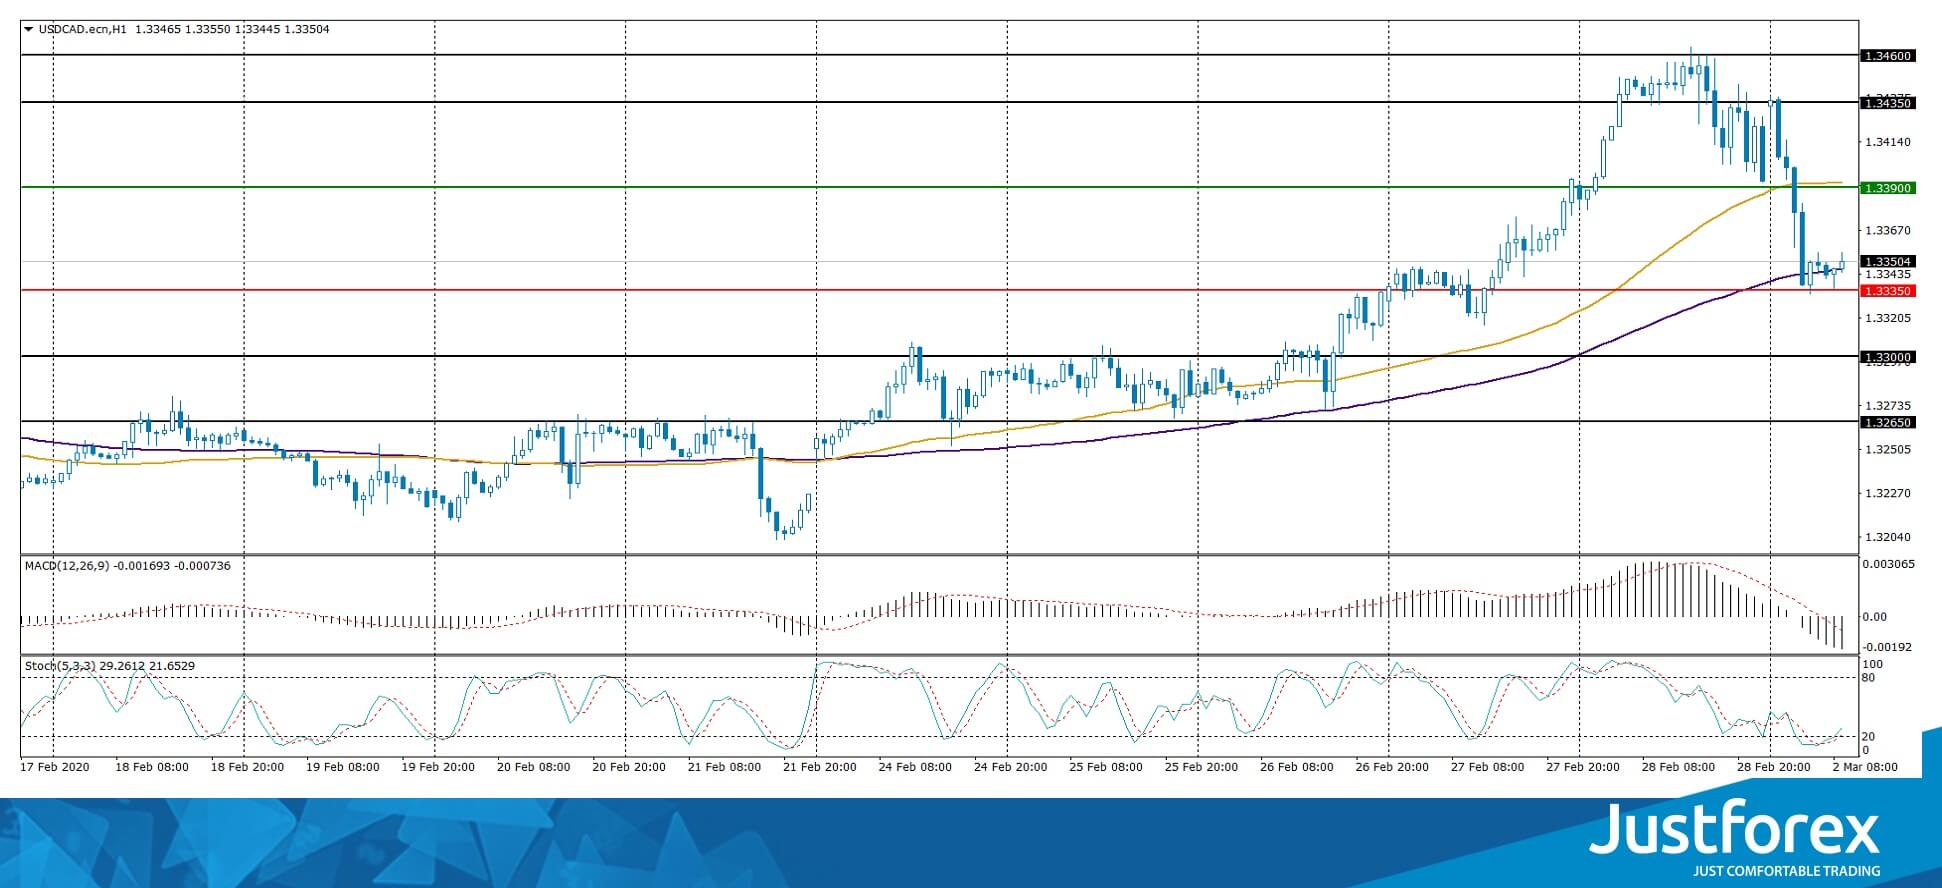
Indicators do not give accurate signals: the price tests 100 MA.
The MACD histogram is in the negative zone, which indicates a bearish sentiment.
The Stochastic Oscillator is located in the oversold area, the %K line crosses the %D line. There are no signals at the moment.
Trading recommendations
Support levels: 1.33350, 1.33000, 1.32650
Resistance levels: 1.33900, 1.34350, 1.34600
If the price fixes below 1.33350, expect further correction toward 1.33000-1.32600.
Alternatively, the quotes could grow toward 1.34300-1.34600.
The USD/JPY currency pair
Technical indicators of the currency pair:
Prev Open: 109.590
Open: 107.449
% chg. over the last day: -1.38
Day’s range: 107.361 – 108.371
52 wk range: 104.45 – 113.53
The USD/JPY has stabilized after a significant drop last week. At the moment the quotes are consolidating. Local support and resistance levels are at 107.850 and 108.500, respectively. Technical correction of the trading instrument is not ruled out in the nearest future. We recommend you to pay attention to the dynamics of US government securities yield. Positions should be opened from key levels.
The news background on Japanese economy is calm.
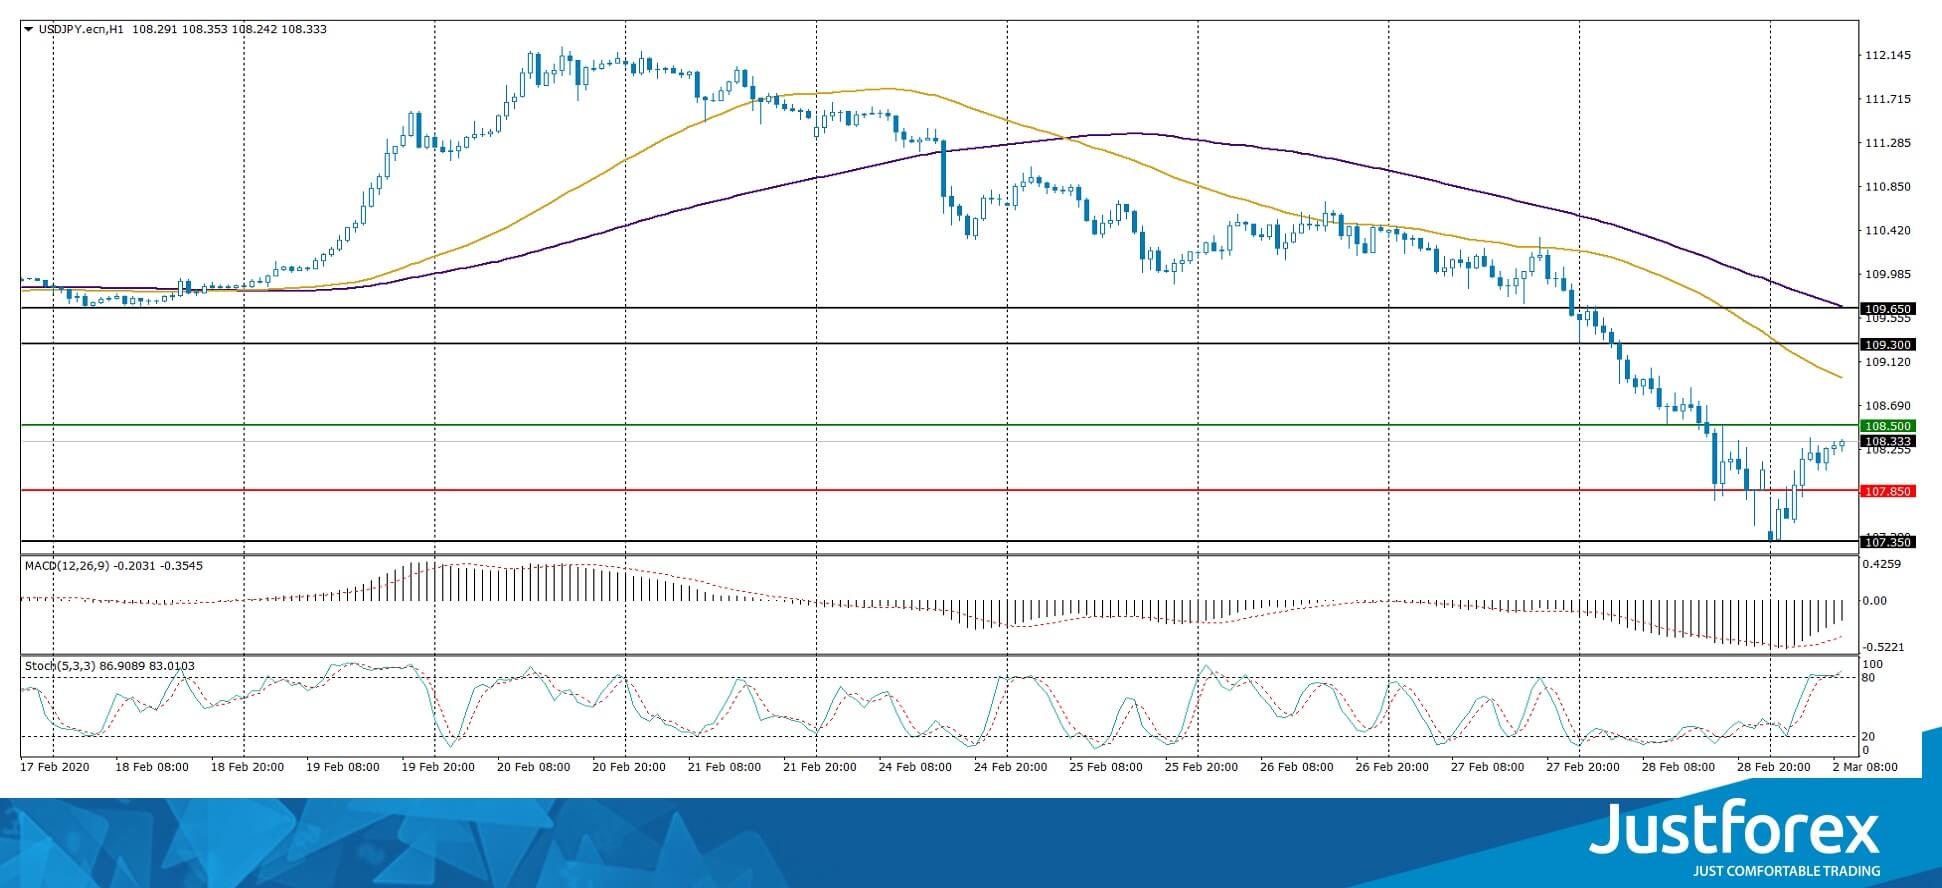
The indicators signal the sellers’ strength: the price has fixed below 50 MA and 100 MA.
The MACD histogram is in the negative zone but above the signal line, which gives a weak signal to sell USD/JPY.
The Stochastic Oscillator is located in the overbought zone, the %K line has crossed the %D line. There are no signals at the moment.
Trading recommendations
Support levels: 107.850, 107.350, 107.000
Resistance levels: 108.500, 109.300, 109.650
If the price fixes above 108.500, expect the quotes to correct toward 109.000-109.500.
Alternatively, the quotes could decline toward 107.000.


