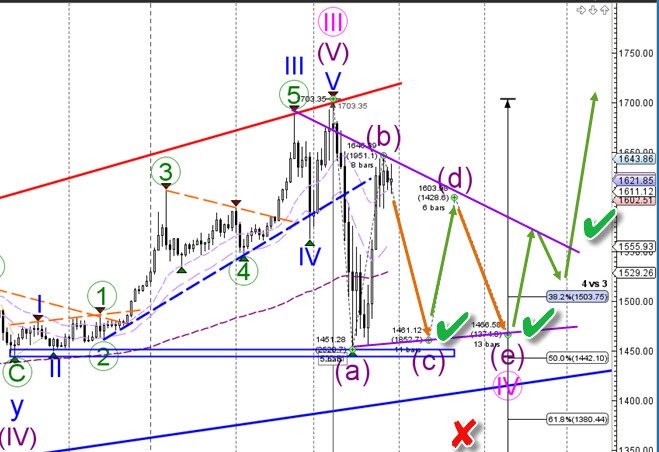
XAU/USD (Gold) made a strong bullish bounce up at the support zone (blue). But the wave patterns, however, suggest a longer correction zone via an ABCDE (purple) triangle.
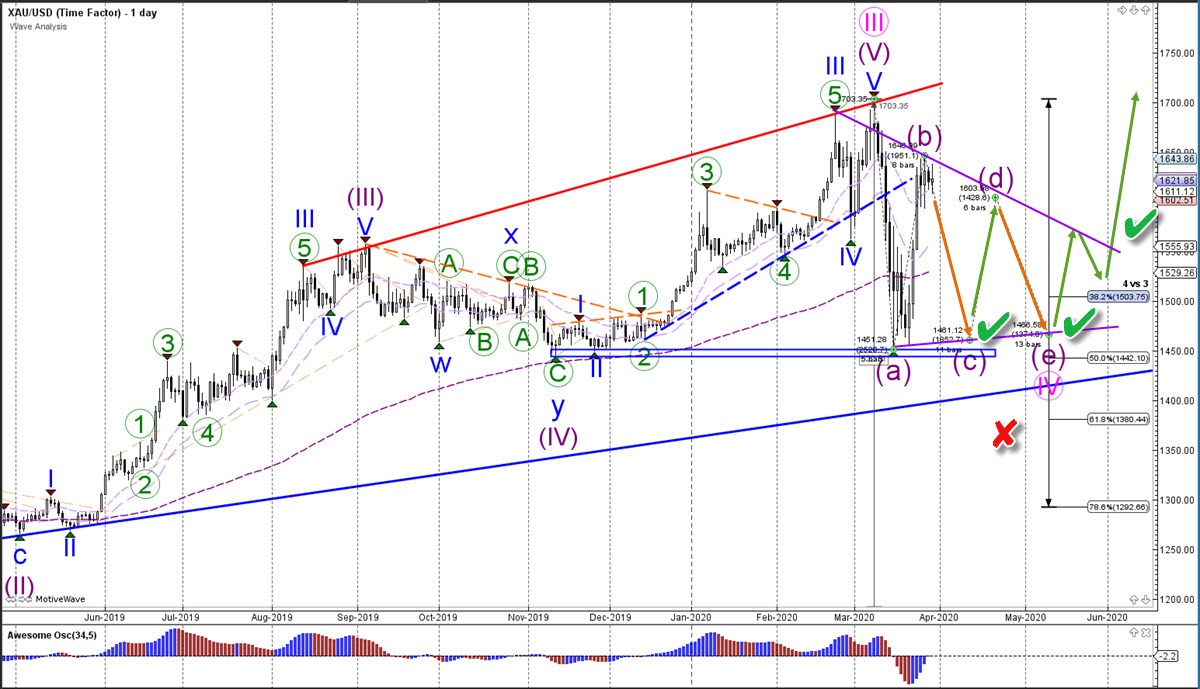
The XAU/USD remains in an uptrend as long as price stays above the 50% Fibonacci level of wave 4 vs 3 and the support trend line (blue). A bearish bounce and swing could confirm the wave C (purple) of the larger ABCDE (purple). A bullish bounce and breakout (green checks) is needed to confirm the uptrend continuation of the Gold bull run. Next target is around the $1,700-$1,750 zone.