
The EUR/USD currency pair
Technical indicators of the currency pair:
Prev Open: 1.08602
Open: 1.08565
% chg. over the last day: -0.05
Day’s range: 1.08449 – 1.08695
52 wk range: 1.0777 – 1.1494
The technical pattern is still ambiguous on the EUR/USD currency pair. The euro is being traded in a flat. At the moment, the local support and resistance levels are 1.0845 and 1.0875, respectively. Financial market participants assess the effects of the coronavirus pandemic. The “black gold” prices have reached multi-year lows due to a significant drop in demand. Over the past month, the number of jobless claims in the US has exceeded 20 million. We recommend opening positions from key levels.
Today, the publication of important economic releases is not expected.
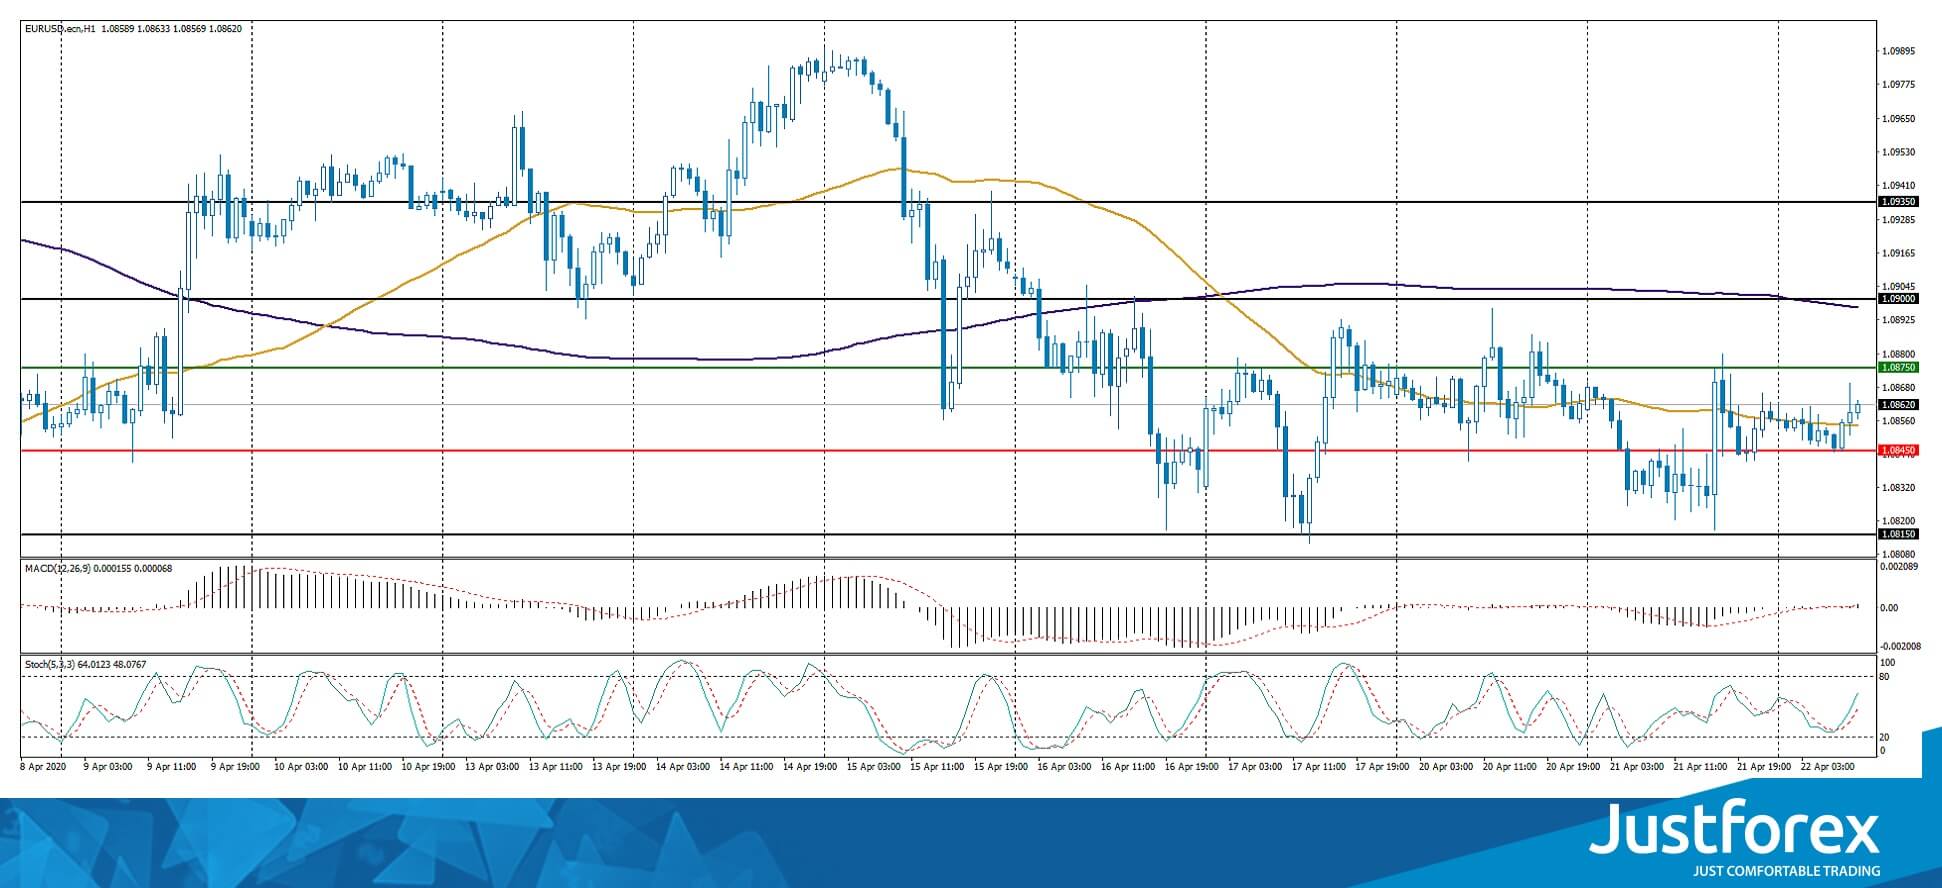
Indicators do not give accurate signals: the price has crossed 50 MA.
The MACD histogram is near the 0 mark.
Stochastic Oscillator is in the neutral zone, the %K line is above the %D line, which indicates the bullish sentiment.
Trading recommendations
Support levels: 1.0845, 1.0815, 1.0800
Resistance levels: 1.0875, 1.0900, 1.0935
If the price fixes below 1.0845, the EUR/USD currency pair is expected to fall. The movement is tending to the round level of 1.0800.
An alternative could be the growth of EUR/USD quotes to 1.0900-1.0930.
The GBP/USD currency pair
Technical indicators of the currency pair:
Prev Open: 1.24286
Open: 1.22863
% chg. over the last day: -1.15
Day’s range: 1.22746 – 1.23306
52 wk range: 1.1466 – 1.3516
There are aggressive sales on the GBP/USD currency pair. The British pound has reached two-week lows. The demand for risky assets is still low. Currently, GBP/USD quotes are consolidating. The local support and resistance levels are 1.2275 and 1.2335, respectively. We do not exclude a further drop in GBP/USD quotes. We recommend opening positions from key support and resistance levels.
In March, the consumer price index in the UK met market expectations and counted to 1.5% (y/y).
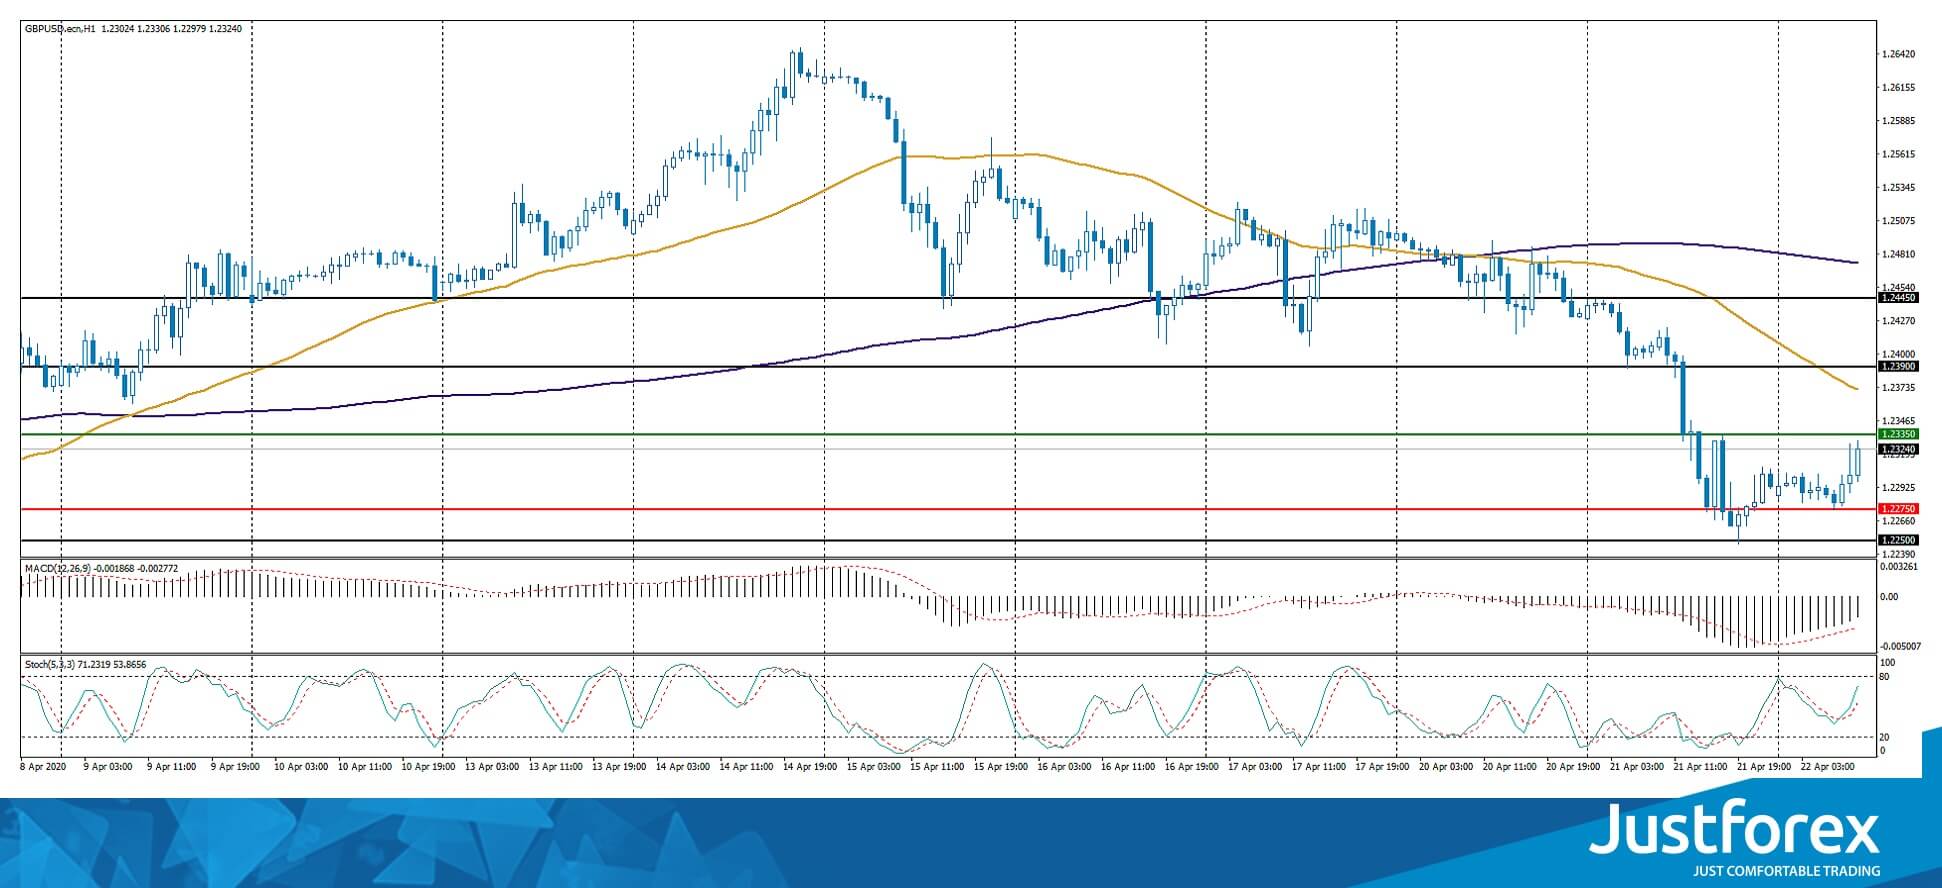
Indicators signal the power of sellers: the price has fixed below 50 MA and 100 MA.
The MACD histogram is in the negative zone, but above the signal line, which gives a weak signal to sell GBP/USD.
Stochastic Oscillator is in the neutral zone, the %K line is above the %D line, which gives a signal to buy GBP/USD.
Trading recommendations
Support levels: 1.2275, 1.2250, 1.2200
Resistance levels: 1.2335, 1.2390, 1.2445
If the price fixes above 1.2335, further growth of GBP/USD quotes is expected. The movement is tending to 1.2380-1.2400.
An alternative could be a decrease in the GBP/USD currency pair to 1.2240-1.2220.
The USD/CAD currency pair
Technical indicators of the currency pair:
Prev Open: 1.41448
Open: 1.42103
% chg. over the last day: +0.44
Day’s range: 1.41607 – 1.42376
52 wk range: 1.2949 – 1.4668
USD/CAD quotes have become stable after a prolonged rally. At the moment, the trading instrument is testing the “mirror” support of 1.4160. The 1.4245 mark is the key resistance. The loonie is still under pressure amid aggressive sales in the “black gold” market. We do not exclude further growth of the USD/CAD currency pair. Investors expect important economic reports from Canada. We recommend opening positions from key levels.
At 15:30 (GMT+3:00), inflation data will be published in Canada.
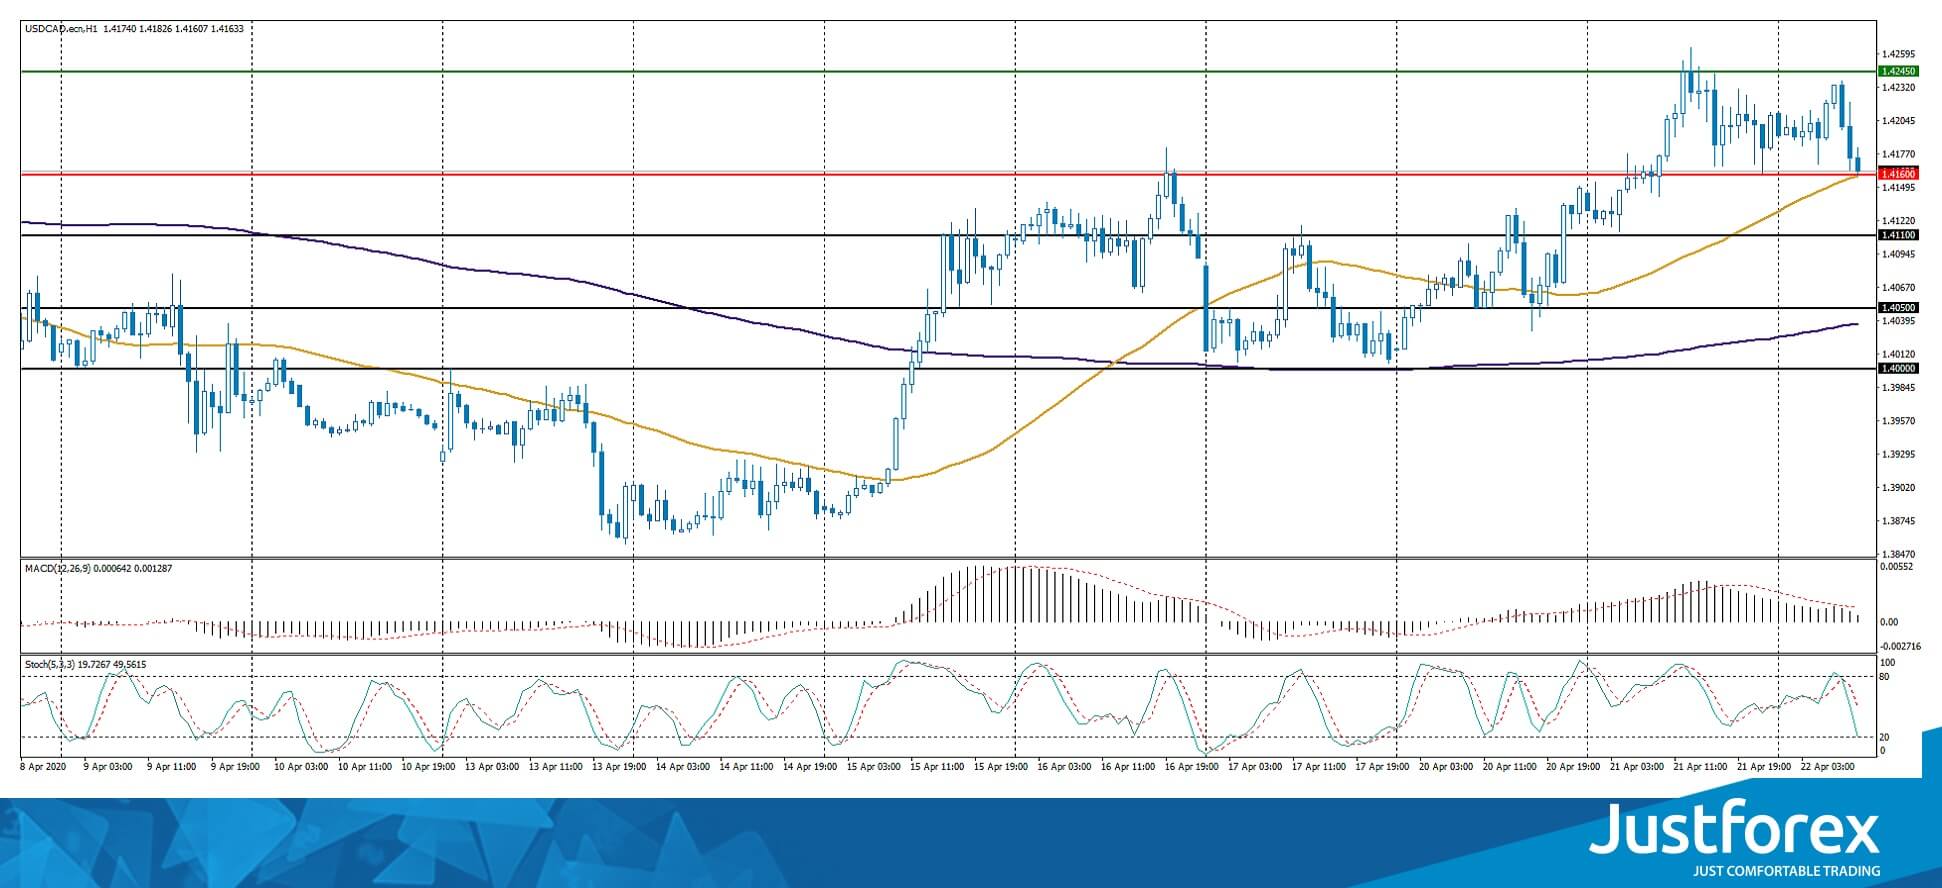
Indicators do not give accurate signals: the price is testing 50 MA.
The MACD histogram has started to decline, indicating a possible correction of the USD/CAD currency pair.
Stochastic Oscillator is in the neutral zone, the %K line is below the %D line, which indicates the bearish sentiment.
Trading recommendations
Support levels: 1.4160, 1.4110, 1.4050
Resistance levels: 1.4245, 1.4300
If the price fixes below the support level of 1.4160, USD/CAD quotes are expected to correct. The movement is tending to 1.4120-1.4100.
An alternative could be the growth of the USD/CAD currency pair to 1.4270-1.4300.
The USD/JPY currency pair
Technical indicators of the currency pair:
Prev Open: 107.612
Open: 107.761
% chg. over the last day: +0.14
Day’s range: 107.516 – 107.868
52 wk range: 101.19 – 112.41
The USD/JPY currency pair is still being traded in a prolonged flat. There is no defined trend. Financial market participants expect additional drivers. At the moment, the local support and resistance levels are 107.50 and 107.85, respectively. Demand for “safe haven” currencies remains at a fairly high level. We recommend paying attention to the dynamics of US government bonds yield. Positions should be opened from key levels.
The news feed on Japan’s economy is calm.
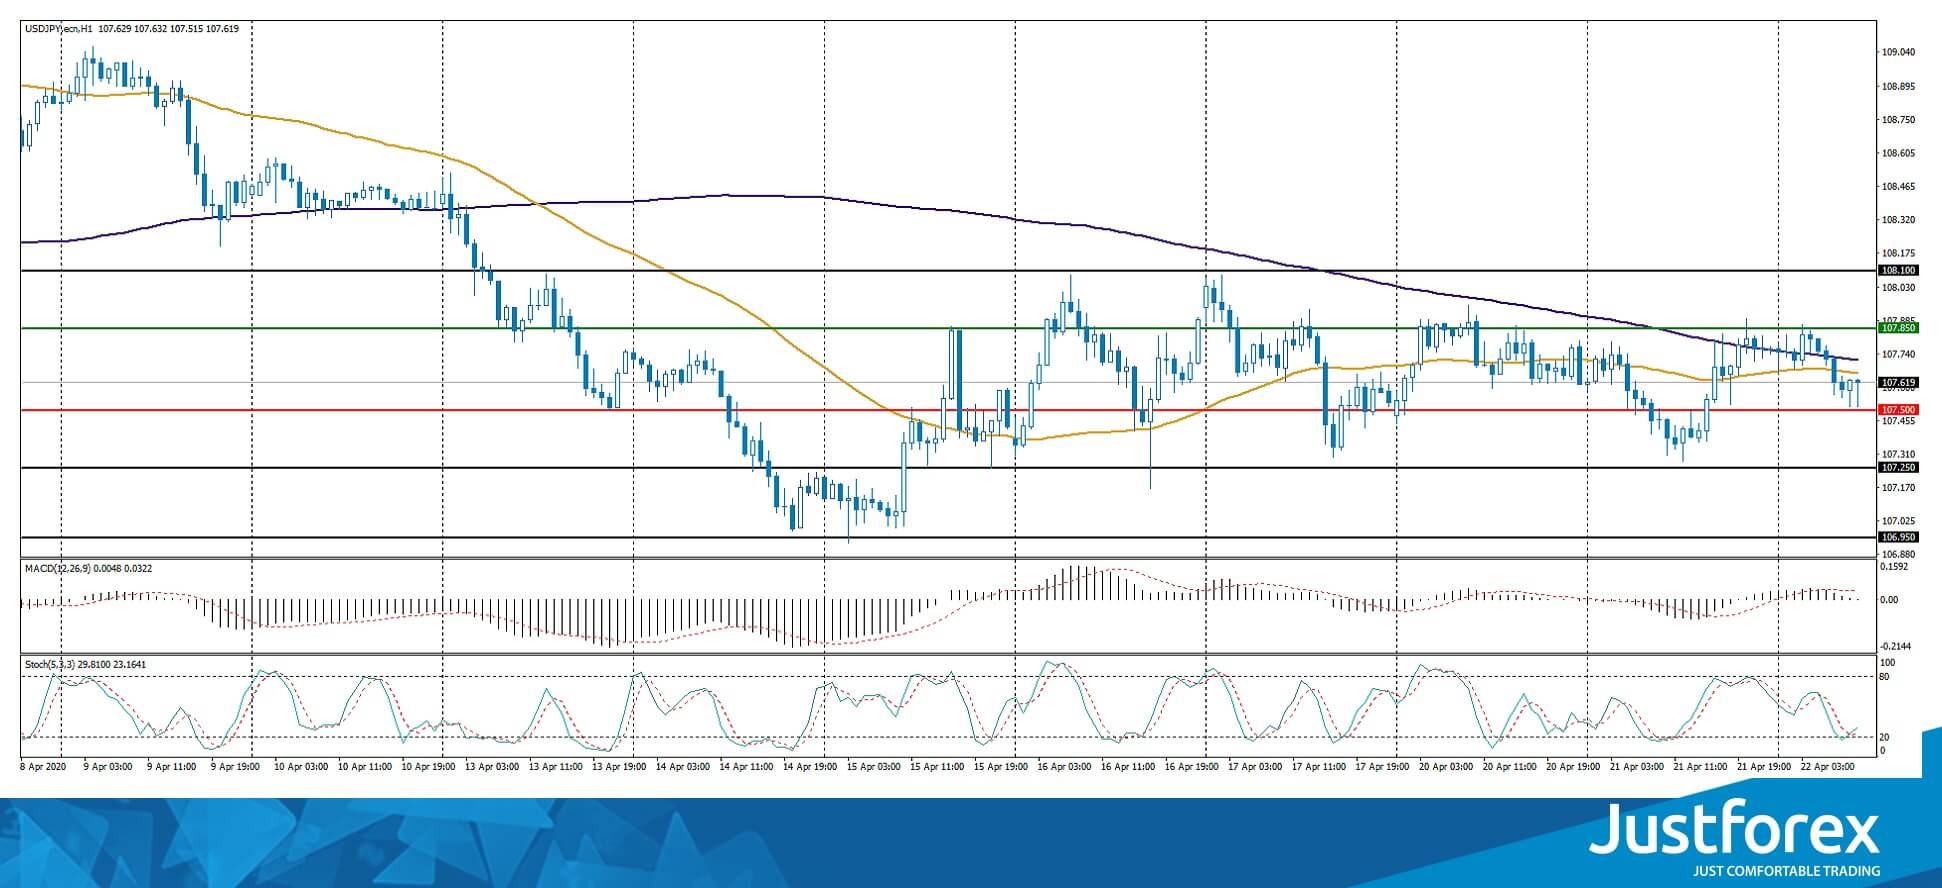
Indicators do not give accurate signals: the price has crossed 50 MA and 100 MA.
The MACD histogram is near the 0 mark.
Stochastic Oscillator is in the neutral zone, the %K line has crossed the %D line. There are no signals at the moment.
Trading recommendations
Support levels: 107.50, 107.25, 106.95
Resistance levels: 107.85, 108.10
If the price fixes below the support level of 107.50, a further drop in the USD/JPY quotes is expected. The movement is tending to 107.20-107.00.
An alternative could be the growth of the USD/JPY currency pair to 108.10-108.30.


