EUR/USD
Current level – 1.0814
With the successful breakthrough of the support zone at 1.0830 and coming out of the range 1.0830-1.0900, it is highly possible to observe a test of the next support level at 1.0770, which would strengthen the negative sentiment of the market participants. In an upward direction, the first major resistance is at 1.1032. Today, the only news that would have an impact on the currency pair’s price movements are the actual results of last week’s data on Initial Jobless Claims (12:30 GMT).
| Resistance | Support | ||
| intraday | intraweek | intraday | intraweek |
| 1.0830 | 1.0960 | 1.0770 | 1.0570 |
| 1.0900 | 1.1030 | 1.0650 | 1.0470 |
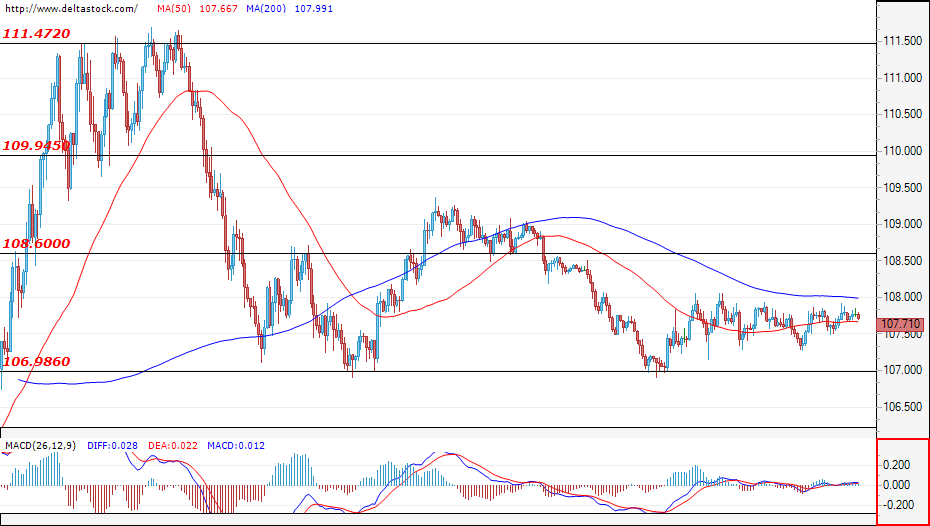
USD/JPY
Current level – 107.71
The currency pair continues its movement between 107.00-108.60, with sentiment remaining mixed for the moment. If the bears take the lead and we witness new sell-offs and a depreciation of the dollar against the yen, the first support is at the lower end of the range – 107.00. A successful breakthrough at this level would lead to deeper sales and further test of the next support at 105.20.
| Resistance | Support | ||
| intraday | intraweek | intraday | intraweek |
| 108.00 | 110.00 | 107.00 | 103.40 |
| 108.60 | 111.50 | 105.50 | 103.40 |
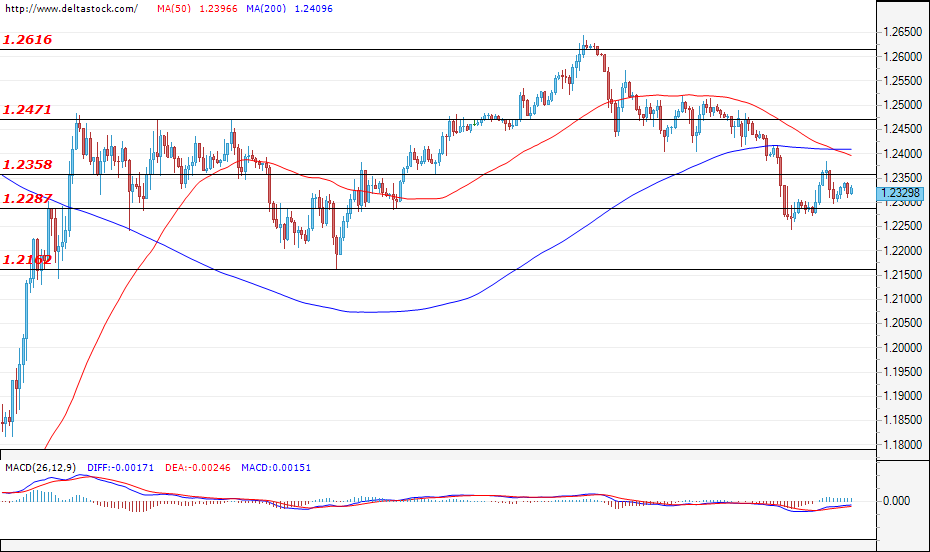
GBP/USD
Current level – 1.2329
After the unsuccessful breakout of the resistance at 1.2360, the currency pair continues its movement in the narrow range 1.2280-1.2360. A break at any of the boundaries of the range would not be sufficient reason to determine the direction of the market. Confirmation with a break at the next levels will be required to do that. In the positive direction, this is the resistance at 1.2470, which would indicate the upward movement and the subsequent test of the next resistance at 1.2616. On the other hand, we could accept the price movement breaks the support zone in the near 1.2160 as a confirmation for negative sentiment.
| Resistance | Support | ||
| intraday | intraweek | intraday | intraweek |
| 1.2360 | 1.2650 | 1.2280 | 1.1800 |
| 1.2470 | 1.2830 | 1.2200 | 1.1440 |