HomeContributorsTechnical AnalysisElliott Wave View: Rally In ASX 200 (XJO) Should Extend

Elliott Wave View: Rally In ASX 200 (XJO) Should Extend

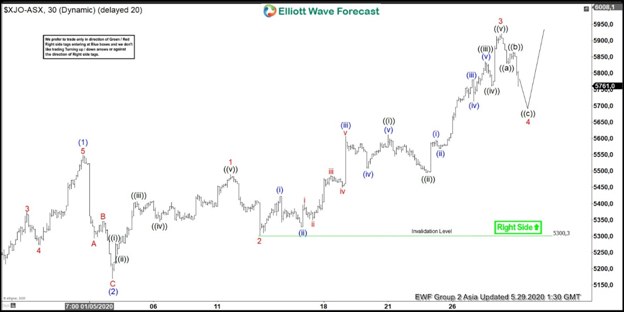
After forming the low on 3.23.2020 low, ASX 200 (XJO) starts a new leg higher. Short term Elliott Wave chart below suggests that the rally from 3.23.2020 low is unfolding as a 5 waves impulsive Elliott Wave structure. Up from 3.23.2020 low, wave ((1)) ended at 5563.6 and pullback in wave ((2)) ended at 5100.7. Index then resumes higher in wave ((3)) and shows a nest. Up from wave ((2)) low at 5100.7, wave (1) ended at 5549.1 and dips to 5169.6 ended wave (2). Wave (3) is currently in progress as another 5 waves of lesser degree.

Up from wave (2) low at 5169.6, wave 1 ended at 5489.5 and dips to 5303.3 ended wave 2. Index then resumes higher in wave 3 towards 5922. Expect wave 4 pullback to find support in 3, 7, or 11 swing before the next leg higher. As far as pivot at 5300.3 low stays intact, expect the Index to extend higher. Potential minimum target for the Index is 100% – 123.6% Fibonacci extension from 3.23.2020 low towards 6268 – 6545

ASX 200 (XJO) 30 Minutes Elliott Wave Chart

Elliott Wave Forecast
Elliott Wave Forecasthttps://elliottwave-forecast.com
ElliottWave-Forecast has built its reputation on accurate technical analysis and a winning attitude. By successfully incorporating the Elliott Wave Theory with Market Correlation, Cycles, Proprietary Pivot System, we provide precise forecasts with up-to-date analysis for 52 instruments including Forex majors & crosses, Commodities and a number of Equity Indices from around the World. Our clients also have immediate access to our proprietary Actionable Trade Setups, Market Overview, 1 Hour, 4 Hour, Daily & Weekly Wave Counts. Weekend Webinar, Live Screen Sharing Sessions, Daily Technical Videos, Elliott Wave Setup videos, Educational Resources, and 24 Hour chat room where they are provided live updates and given answers to their questions.

Featured Analysis

Learn Forex Trading