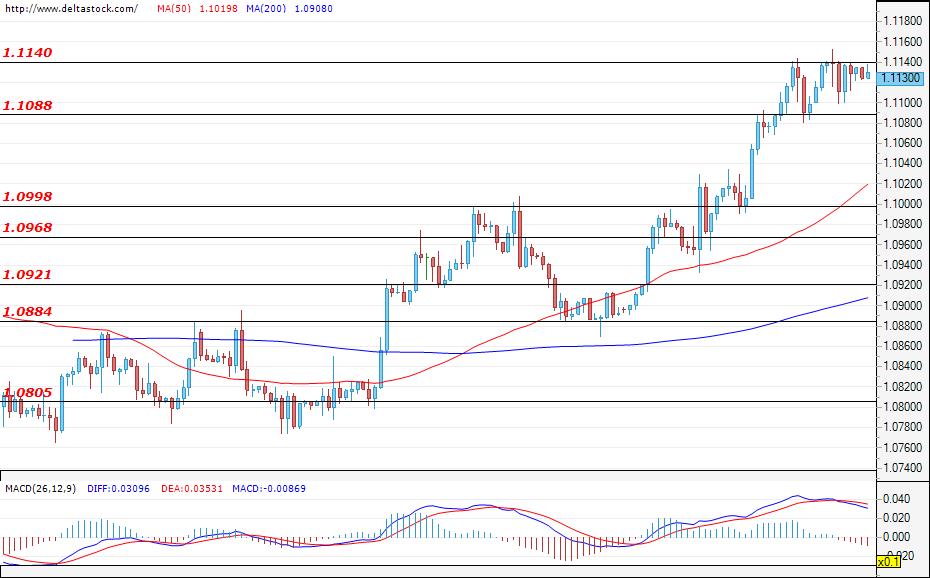
EUR/USD
Current level – 1.1130
The resistance zone at 1.1140 put a stop to the bullish momentum, but the positive sentiment of the market participants is still intact, despite the slowdown in price action. If the bulls manage to successfully break the aforementioned level, the most probable scenario for the currency pair will be a move towards the next resistance zones at 1.1180, followed by 1.1240. If bears take control, we might see a development of a deeper correction and a test of the first support zone at 1.1088, but only a deeper decline and violation through the support at 1.0998 would spell bearish expectations for the future path of the EUR/USD.
| Resistance | Support | ||
| intraday | intraweek | intraday | intraweek |
| 1.1140 | 1.1180 | 1.1080 | 1.0920 |
| 1.1190 | 1.1240 | 1.1000 | 1.0880 |
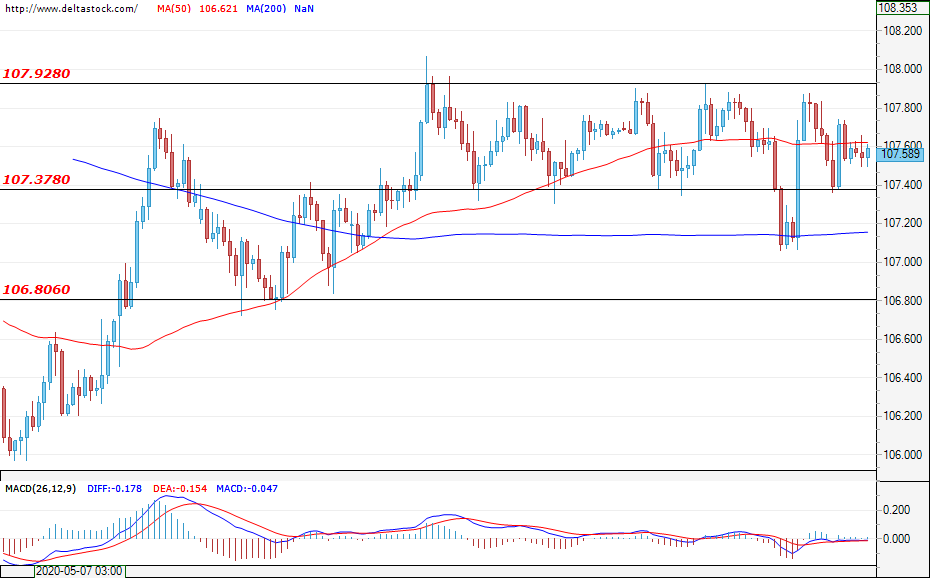
USD/JPY
Current level – 107.58
The case with USD/JPY remains the same as yesterday as the currency pair continues trading in the narrow range between 107.92 and 107.37. A successful breakthrough of the resistance zone at 107.92 could pave the way to the next target at 108.06, which, if broken, will draw a more bullish picture for the USD/JPY. In the negative direction, an increase in bearish pressure could lead to a test of the support level at 107.37, followed by 106.80.
| Resistance | Support | ||
| intraday | intraweek | intraday | intraweek |
| 107.90 | 110.00 | 107.37 | 106.80 |
| 109.20 | 111.64 | 106.80 | 106.45 |
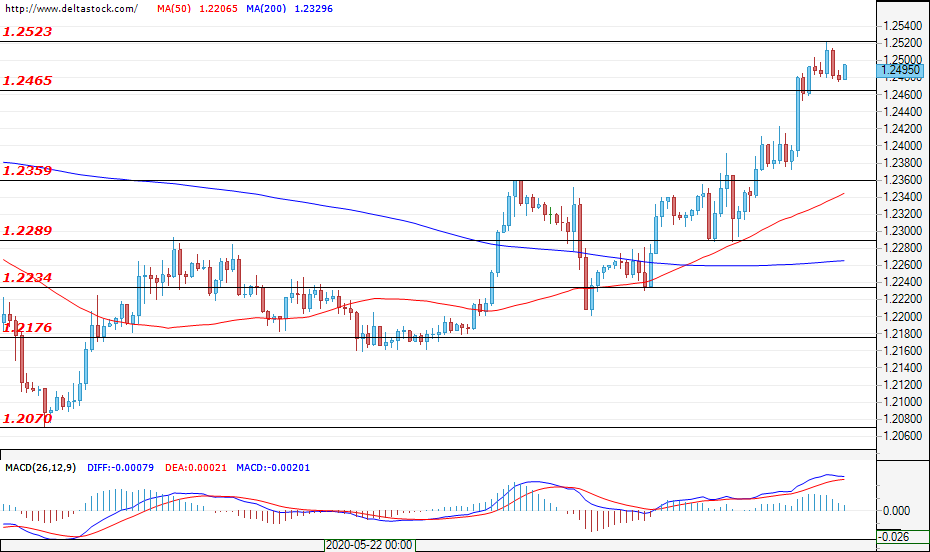
GBP/USD
Current level – 1.2495
During yesterday’s trading, the Cable continued to gain positions against the Greenback as the bullish momentum helped the pair successfully breach the resistance level at 1.2465. At the moment of writing, the GBP/USD is managing to hold above the aforementioned level of resistance and a continuation of the current move is quite probable, with the first target being 1.2520, followed by levels from the end of April at around 1.2640. Alternatively, if bears enter the market, the first support lies at 1.2359, where a breach could lead the pair towards a test of the next zone at 1.2289. This will draw a more bearish picture for the pair.
| Resistance | Support | ||
| intraday | intraweek | intraday | intraweek |
| 1.2520 | 1.2600 | 1.2360 | 1.2170 |
| 1.2640 | 1.2640 | 1.2290 | 1.2070 |