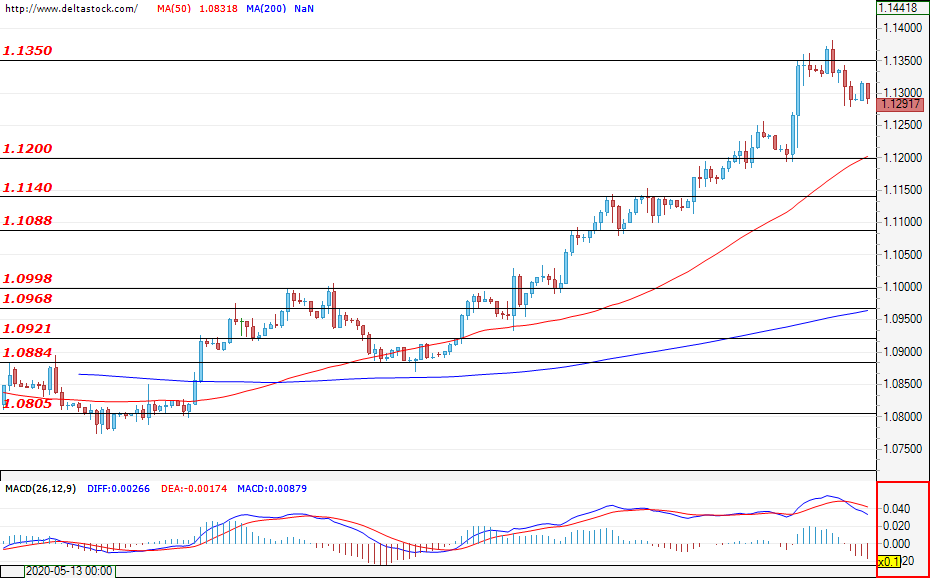
EUR/USD
Current level – 1.1291
The rally from Friday was limited under the resistance zone at 1.1350 and now the currency pair consolidated around the current price at 1.1291. Bullish sentiments are still intact and а new test of the aforementioned zone is highly probable. Success here, could easily point the EUR to new future gains against the US dollar. If bears take control, the first support lies at 1.1200, followed by 1.1140. High volatility is expected on Thursday 18:30 CEET when the Fed Interest Rates decision is awaited.
| Resistance | Support | ||
| intraday | intraweek | intraday | intraweek |
| 1.1350 | 1.1400 | 1.1200 | 1.1000 |
| 1.1400 | 1.1510 | 1.1140 | 1.0920 |
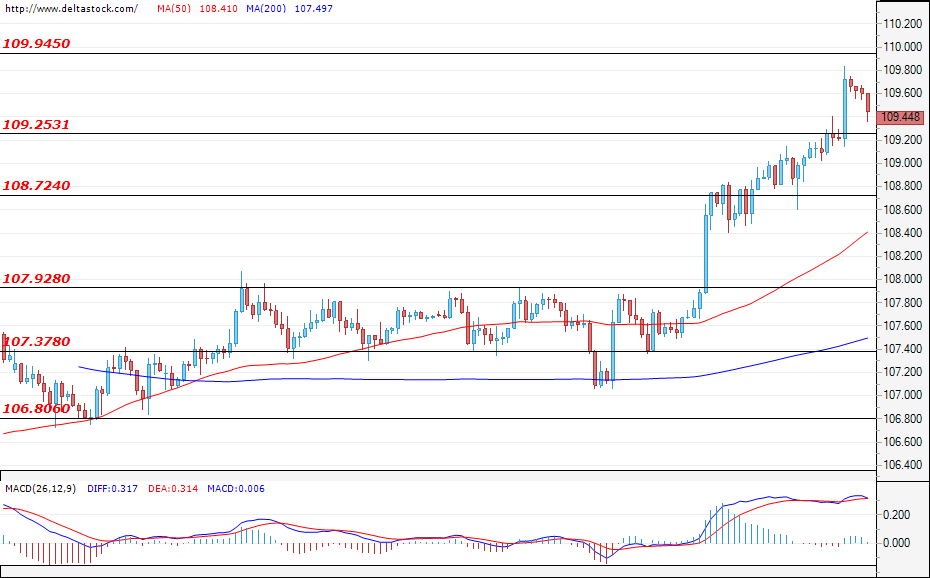
USD/JPY
Current level – 109.44
The USD continues to lose ground against the yen and the currency pair successfully breached the resistance zone at 109.25 last week, managing to hold above the level. Next target for buyers lies at the upper zone at 109.94. A successful breach could strengthen the positive expectations for the future path of the USD/JPY. In downward direction, a decrease and deeper correction is possible, but only a breach through the support zone at 108.72 could show some changes in the current sentiments of the market participants.
| Resistance | Support | ||
| intraday | intraweek | intraday | intraweek |
| 109.94 | 110.00 | 108.70 | 106.80 |
| 111.50 | 111.64 | 108.00 | 106.45 |
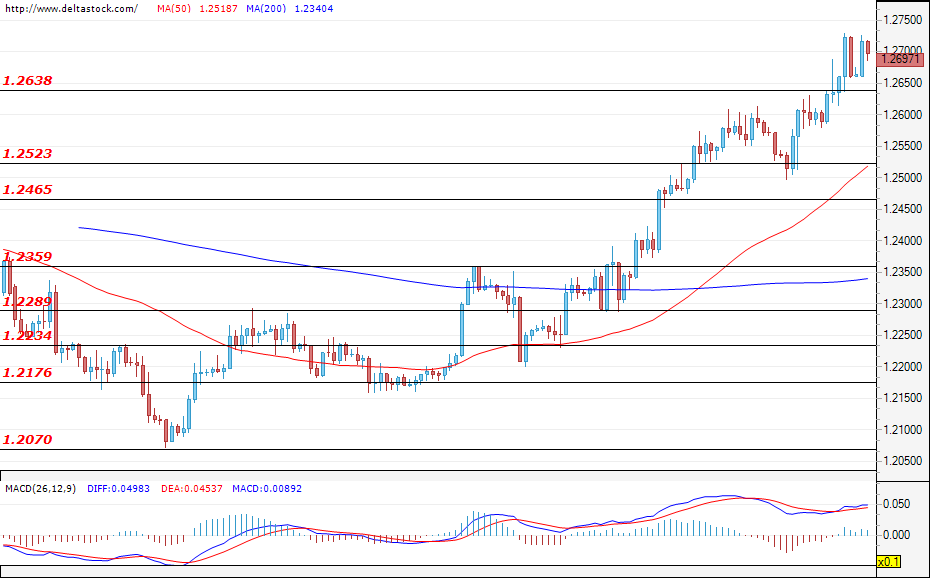
GBP/USD
Current level – 1.2697
Similar to the other currency pairs, here the USD is once again losing positions. The price of GBP managed to breach the resistance level at 1.2638 and continues its positive run, heading to the upper important zone at 1.2800 from the bigger time frames. There a breach could pave the way for the Cable to the highs from the end of February and beginning of March around 1.3200. If bears enter the market, the first important support level for them lies at 1.2523, followed by the lower one at 1.2465.
| Resistance | Support | ||
| intraday | intraweek | intraday | intraweek |
| 1.2750 | 1.2850 | 1.2638 | 1.2360 |
| 1.2825 | 1.3000 | 1.2520 | 1.2290 |