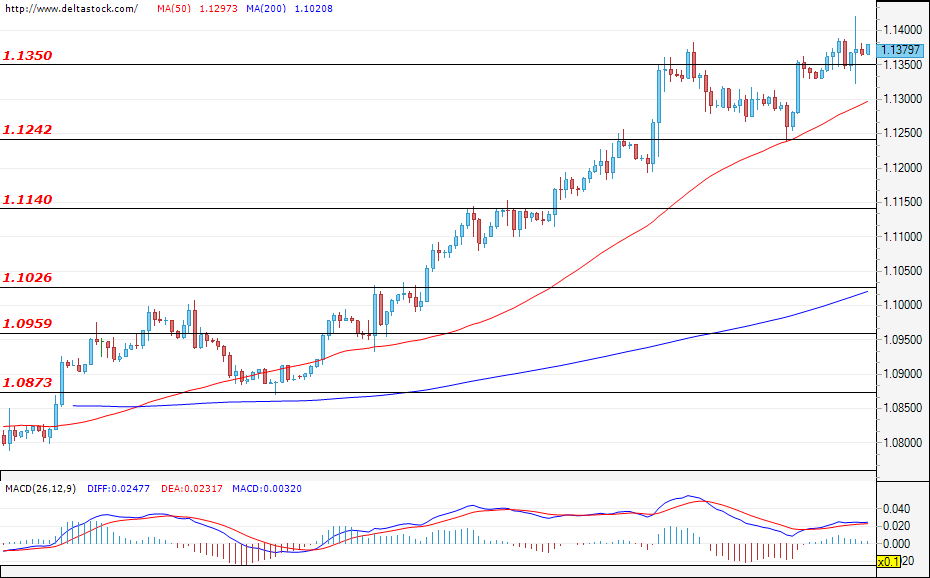
EUR/USD
Current level – 1.1379
The unchanged federal fund rates from yesterday helped buyers remain in control. And despite the observed volatility, the price successfully held above the resistance zone at 1.1350. A continuation of the upside move can be expected, towards a test at the highs from March at around 1.1460, followed by 1.1494. If bears take the reins, we could see a steeper downward retracement aimed at the support zone at 1.1242, a successful violation of which could change the current sentiment of the market participants.
| Resistance | Support | ||
| intraday | intraweek | intraday | intraweek |
| 1.1400 | 1.1570 | 1.1350 | 1.1200 |
| 1.1510 | 1.1630 | 1.1240 | 1.1140 |
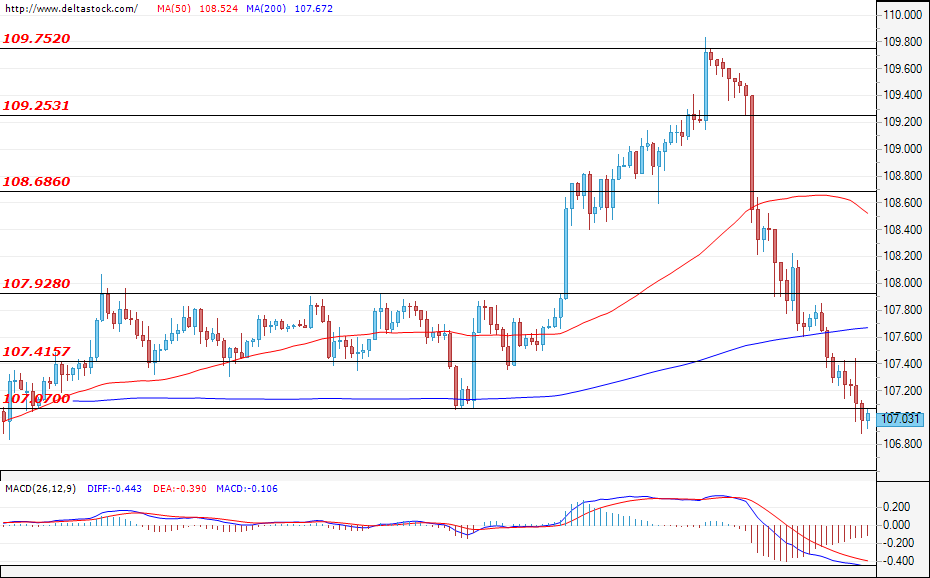
USD/JPY
Current level – 107.03
The Dollar continues to lose ground against the Yen and the price successfully breached the lower border of the previously formed trading channel at 107.41, and has headed towards the next target at 107.07. A successful test and breach here could easily pave the way towards May’s support level at 106.45, followed by the next target of 105.96. If bulls re-enter the market, a correction towards the former support zone – now turned resistance – at 107.40, and a test of the higher one at 107.92 can be expected.
| Resistance | Support | ||
| intraday | intraweek | intraday | intraweek |
| 107.40 | 110.00 | 106.45 | 106.40 |
| 107.90 | 111.64 | 105.96 | 106.80 |
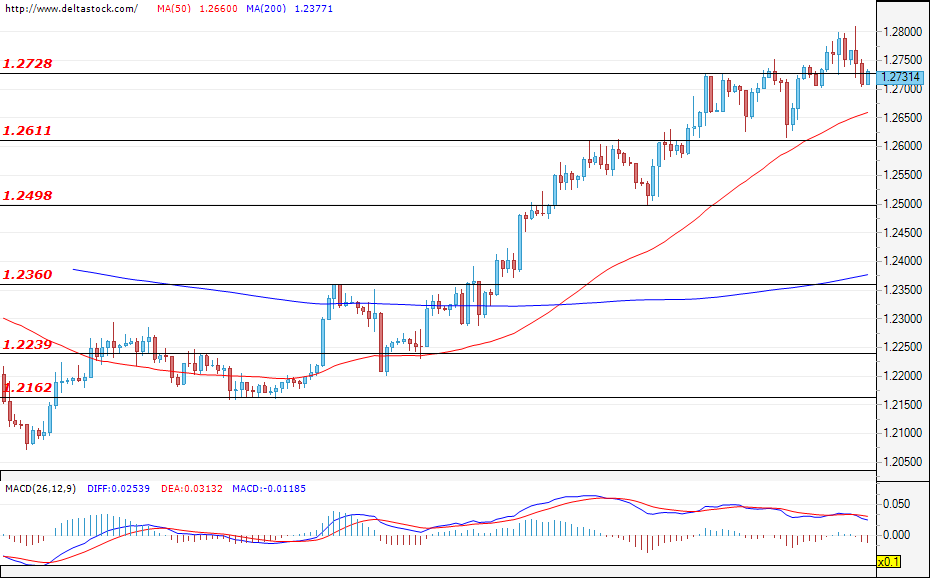
GBP/USD
Current level – 1.2731
The Cable continues its struggle to break through the resistance zone at 1.2728 and, at the time of writing, the pair is going for another test of the mentioned resistance, with neither the bulls nor the bears exercising enough power to confirm the future direction. A successful upside breach will show that the rally has not lost steam and may lead to a test of the resistance zones at 1.2880 and possibly the one at 1.3000. In a negative outcome, the first support level lies at 1.2611, followed by the next target at 1.2498.
| Resistance | Support | ||
| intraday | intraweek | intraday | intraweek |
| 1.2730 | 1.2880 | 1.2610 | 1.2360 |
| 1.2825 | 1.3000 | 1.2500 | 1.2290 |