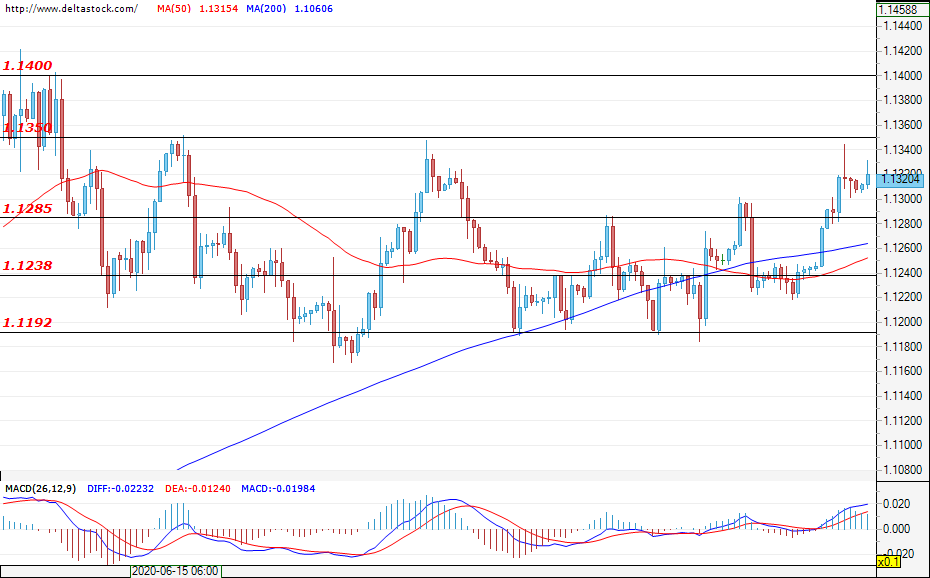
EUR/USD
Current level – 1.1320
After the successful confirmation of the breach at the resistance zone of 1.1285 from yesterday, the bullish momentum continues today as the currency pair heads for a test of the important resistance level at 1.1350. Successful breakthrough here could easily lead the EUR/USD to the next target at 1.1400 and, possibly, to the March highs of around 1.1450. If the resistance level holds, this could be an opportunity for the bears to re-enter the market and push the price back under the aforementioned 1.1285 level, to the support level at 1.1240 or, if the move gains momentum, the lower target at 1.1190.
| Resistance | Support | ||
| intraday | intraweek | intraday | intraweek |
| 1.1350 | 1.1400 | 1.1285 | 1.1192 |
| 1.1400 | 1.1500 | 1.1240 | 1.1140 |
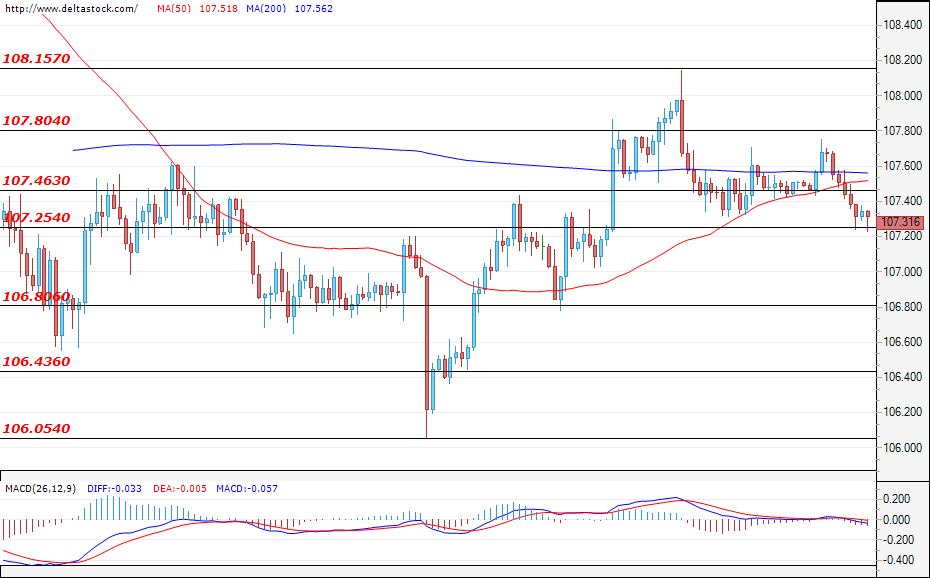
USD/JPY
Current level – 107.31
Yesterday the bears took short-term control and now the currency pair is about to test the support level at 107.26. A continuation of the current downward move is probable and a successful breach of 107.26 could head the USD/JPY to the lower support zone at 106.80, leading to further losses for the USD against the YEN. In the upward direction, the first target for the buyers lies at 107.46, but only a violation of the resistance level at 107.80 could improve the expectations for the future path of the USD/JPY.
| Resistance | Support | ||
| intraday | intraweek | intraday | intraweek |
| 107.50 | 108.15 | 107.20 | 106.00 |
| 107.80 | 108.50 | 106.80 | 105.00 |
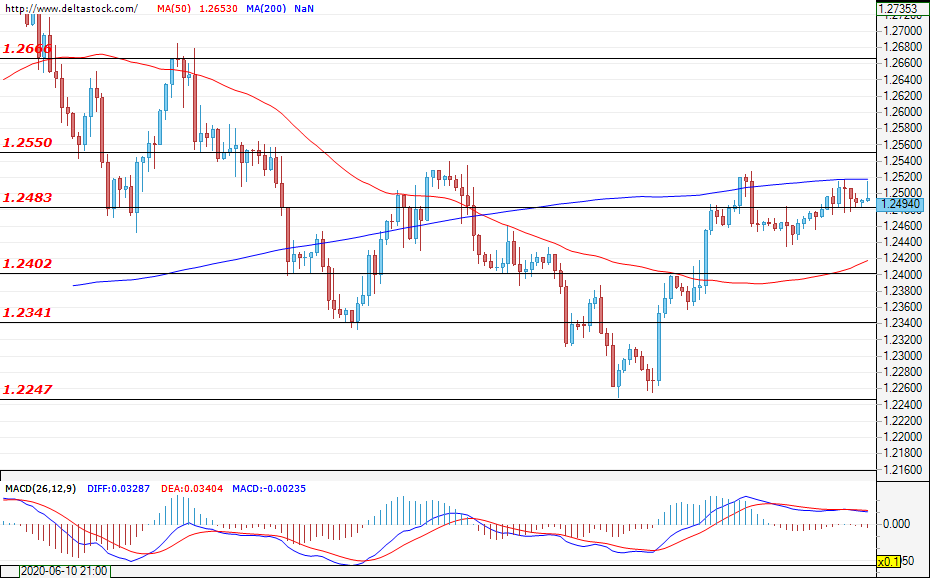
GBP/USD
Current level – 1.2494
The GBP/USD is trading just above 1.2480 and a new positive push could probably lead the GBP/USD towards a test of the important resistance zone at 1.2550. А successful breach of this level could show positive market sentiments and lead to an attempt of reaching the highs around 1.2666. If the bears enter the market, their first target lies at 1.2402, followed by the next support level at 1.2341.
| Resistance | Support | ||
| intraday | intraweek | intraday | intraweek |
| 1.2550 | 1.2665 | 1.2480 | 1.2360 |
| 1.2665 | 1.2800 | 1.2400 | 1.2250 |