EUR/USD
What started as a dull Monday, ended up with the EUR/USD pair reaching a fresh 2017 high of 1.1831, level last seen early January 2015, as mixed US data was not enough to revert the prevailing negative sentiment towards the American currency. The greenback advanced modestly before changing course, holding on to modest gains only against the CAD, undermined by a retracement in oil prices. As for the EUR/USD pair, it settled above the 1.1800 level, helped by a slightly improvement in European inflation according to July preliminary estimates released this Monday. Cope CPI is estimated to have risen by 1.2% yearly basis, beating expectations of 1.1%. Headline inflation remained steady at 1.3%. In Germany, retail sales were up 1.1% in June, above the 0.5% expected, although the annual reading came in at 1.5%, well below market’s forecast of 2.7%. In the US, the Chicago PMI fell to 58.9 in July from 65.7 in June, the lowest level in three months, whilst the Dallas index surged to 16.8 from previous 15.0. Pending home sales surged by 1.5% in June, better-than-expected, although low inventories persist, holding back activity.
The macroeconomic calendar will remain quite busy all through the week, with final July PMIs and Q2 GDP for the EU being released early Tuesday, followed by US Personal Income and Spending figures, including PCE inflation, Fed’s favorite measure when it comes to take decisions.
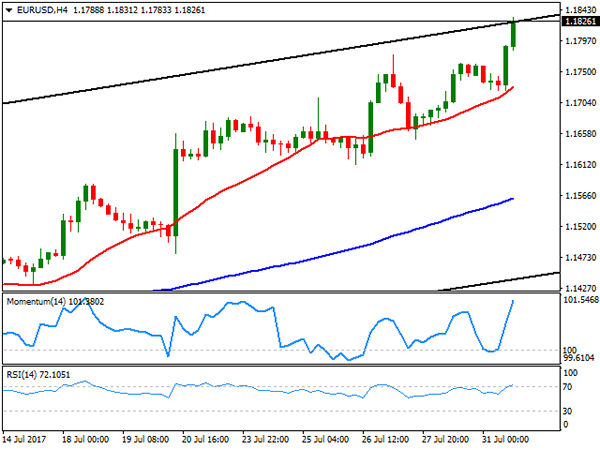
From a technical point of view, the EUR/USD pair has reached the top of the daily ascendant channel that led the way since mid April, unable to break it but pressuring it ahead of the Asian opening, signaling a possible upward acceleration on a break above it during the upcoming sessions. In the 4 hours chart, the price has met buying interest on a slide down to a bullish 20 SMA, whilst the Momentum indicator maintains its strong upward slope near overbought levels, whilst the RSI indicator hovers around 70, all of which favors the upside. The immediate resistance is now 1.1845, January 14th 2015 high, followed by the 1.1870 price zone, where the pair presents multiple daily highs and lows from earlier that month. Further gains, particularly if US upcoming data remain soft can see the rally extending up to 1.2101, the high for the mentioned month.
Support levels: 1.1780 1.1750 1.1715
Resistance levels 1.1845 1.1870 1.1910
USD/JPY
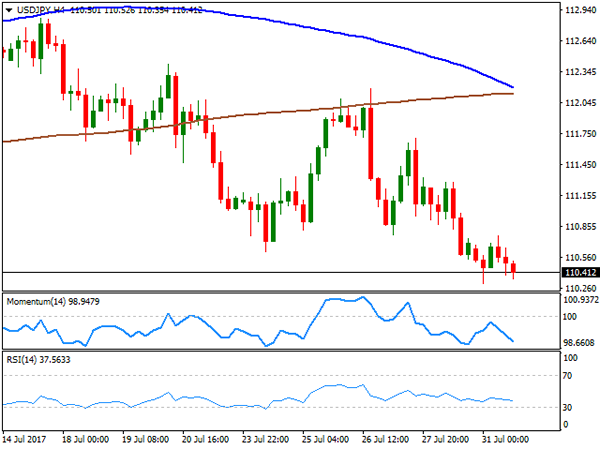
The USD/JPY pair extended its July’s decline to 110.30 and settled around 110.40, down for a second consecutive day, as escalating tensions between North Korea and the US over the weekend fueled demand for the safe-haven currency at the beginning of the day, while mixed US data kept the greenback subdued in the American afternoon. Japanese industrial production bounced back in June, up by 1.6%, slightly below market’s expectations of 1.7%, but well above May’s 3.6% decline. Additionally, housing starts surged by 1.7% in June, while orders rose by 2.3%, although the news had little effect on the yen. During the upcoming Asian session, attention will focus on the Nikkei manufacturing PMI, expected unchanged at 52.2. The pair maintains a clear bearish stance intraday, as in the 4 hours chart, the price is further below its 100 and 200 SMAs, with the shortest about to cross below the larger, and technical indicators maintaining strong bearish slopes near oversold readings ahead of the Asian opening. Below the mentioned daily low, the pair has scope to extend its decline towards the 109.80/90 price zone, with a break lower opening doors for a steeper slide towards 108.80, June’s monthly low.
Support levels: 110.30 109.85 109.40
Resistance levels: 110.80 111.20 111.60
GBP/USD
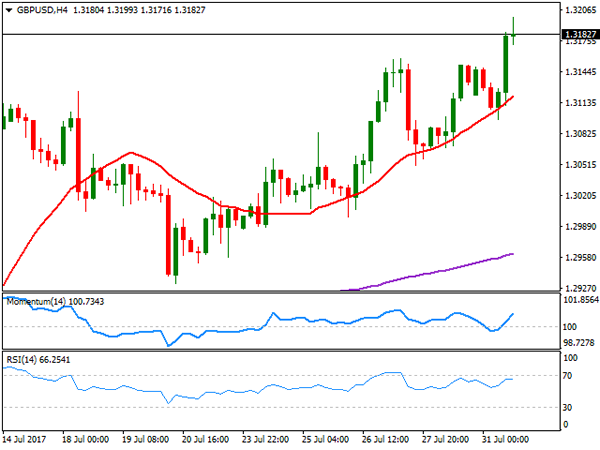
The GBP/USD pair surged to 1.3199, its highest since September last year, ending the day a few pips below the level, on the back of persistent dollar’s weakness. In the UK, mortgage approvals were the lowest in nine months in June according to official money figures, with 64,684 approvals in June, down from 65,109 in May. Consumer credit growth fell modestly, with the annual rate of growth at 10% from 10.4% in the previous month. The report also showed that non-mortgage lending to consumers dropped from £1.8 billion in May to £1.5 billion in the same month. The Markit manufacturing PMI for July in the kingdom to be released this Tuesday is expected at 54.3, although the most relevant event for the week will be the BOE’s monetary policy meeting on Thursday, which will bring fresh economic outlooks. From a technical point of view, the 4 hours chart shows that the bullish tone persists ahead of the Asia opening, with the price holding above a bullish 20 SMA and the Momentum indicator heading north above its 100 level, whilst the RSI consolidates around 66, rather reflecting the low volume at this time of the day than suggesting upward exhaustion.
Support levels: 1.3100 1.3060 1.3020
Resistance levels: 1.3160 1.3200 1.3250
GOLD
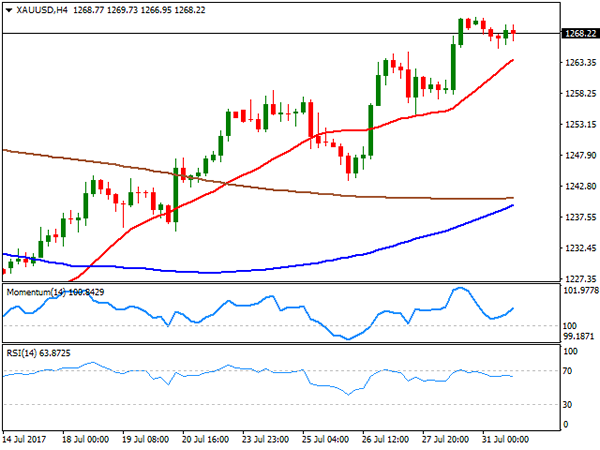
Spot gold settled at $1,268.32 a troy ounce, marginally lower daily basis, despite a peak of risk aversion at the beginning of the day and dollar’s broad weakness. The commodity held near its recent highs, in fact advancing by a few cents, to a fresh July high of 1,270.97, but was unable to extend its rally, most likely retreating on profit taking at the last day of the month. From a technical point of view, the daily chart shows that technical indicators are retreating modestly, still within overbought territory, but the price remains well above all of its moving averages, while sentiment favor the upside, suggesting that any downward corrective movement will likely be corrective. In the shorter term, and according to the 4 hours chart, gold is biased higher, as the price remains well above a bullish 20 SMA, now the immediate support at 1,264.00, whilst the Momentum indicator heads north above its 100 level and the RSI indicator consolidates around 65, in line with additional gains, particularly on an advance beyond 1,271.10, the immediate resistance.
Support levels: 1,264.00 1,254.75 1,245.20
Resistance levels: 1,271.10 1,283.30 1,290.10
WTI CRUDE OIL
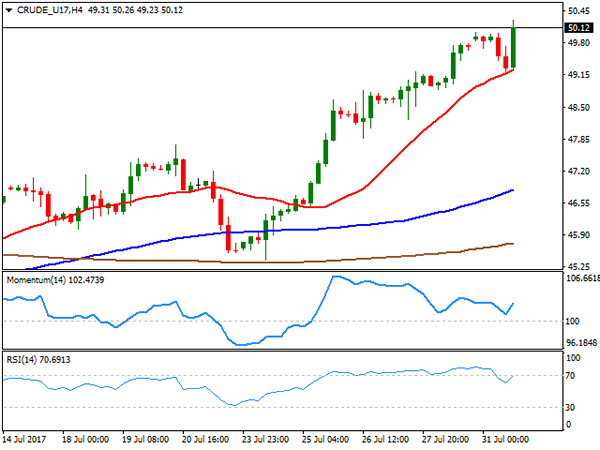
Crude oil prices continued advancing in the last trading day of the month, with West Texas Intermediate crude futures settling at $50.13 a barrel after reaching a high of 50.26. The US benchmark posted its largest monthly gains for this year, holding at its highest in over eight weeks, as tensions in Venezuela and possible sanctions to the country from the US could result in a shortage of heavy oil for US refineries, somehow helping balancing the market. On the negative side, Reuters reported that OPEC oil output has risen this month by 90,000 barrels per day to a 2017 high, while in the US crude oil production rose 59,000 bpd in May to 9.169M bpd vs. revised 9.11M bpd in April. The commodity bounced from a daily low of 49.17 ahead of the close, and the daily chart shows that the price is surpassing its 200 DMA by a few cents, whilst technical indicators have lost upward strength, the Momentum easing, but the RSI holding near overbought levels. In the 4 hours chart, the price found support at a bullish 20 SMA, currently at 49.35, whilst the RSI indicator hovers around 70, but the Momentum lost upward strength, still diverging from price’s action.
Support levels: 49.90 49.35 48.80
Resistance levels: 50.20 50.85 52.40
DJIA
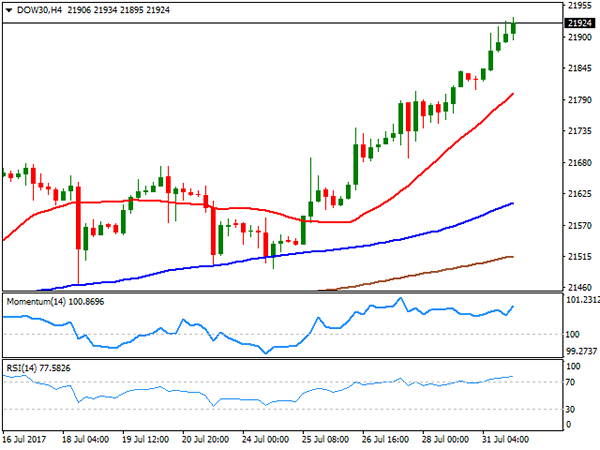
Wall Street closed mixed, with the Dow Jones closing at an all-time high of 21,891.12 after adding 60 points. The Nasdaq Composite lost 0.42%, to 6.348.12, while the S&P lost 0.07%, and ended at 2,470.30. The indexes, however, posted monthly gains with the Dow up for fourth consecutive month. Home Depot was the best performer, up 1.03%, followed by Chevron that added 0.99%. El du Pont led decliners with a 2.11% loss, followed by Apple that shed 0.52%. The daily chart for the index shows that it stands near its daily high, and with scope to continue advancing according to the Momentum indicator, holding within positive territory. The RSI in the mentioned chart heads north around 73, while the index remains above all of its moving averages, further supporting gains ahead. In the 4 hours chart, technical indicators extended their advances within overbought levels, whilst the 20 SMA extended its advance below the current level, in line with further gains ahead.
Support levels: 21,814 21,766 21,718
Resistance levels: 21,900 21,945 21,990
FTSE100
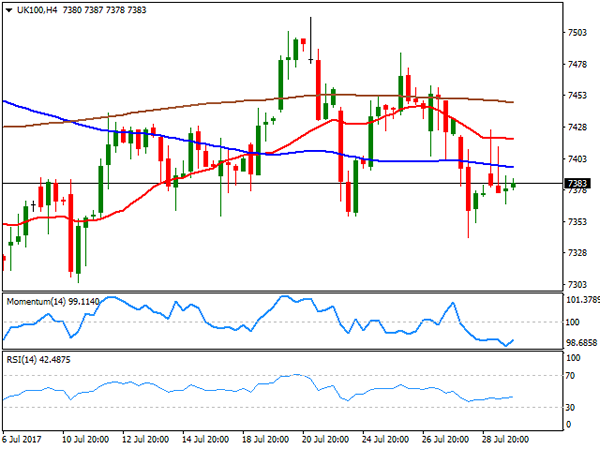
The FTSE 100 managed to hold in the green, despite most European indexes closed lower, lifted by mining-related equities. The London benchmark added 3 points or 0.05% to end at 7,372.00, up for the month by 0.8%. An advance in mining-related equities, and a strong earnings report from HSBC bolstered the index, as the company posted a 5% increase in profits. Utilities were the best performers across the region, after RBC lifted the rating of Seven Trent, up 4.09% and United Utilities that added 2.98%, to "outperform." Leading losers’ list were tobacco companies, still pressured by Friday’s US FDA announcement on reducing nicotine levels. Imperial Brands lost 5.90%, while British American Tobacco closed 4.97% lower. The daily chart for the index shows that it holds around a flat 100 DMA, while technical indicators hover around their mid-lines, lacking directional strength. In the 4 hours chart, the index remains below all of its moving averages that anyway lack directional strength, whilst indicators aim modestly higher well below their mid-lines, far from suggesting an upward movement ahead.
Support levels: 7,340 7,294 7,257
Resistance levels: 7,398 7,434 7,587
DAX
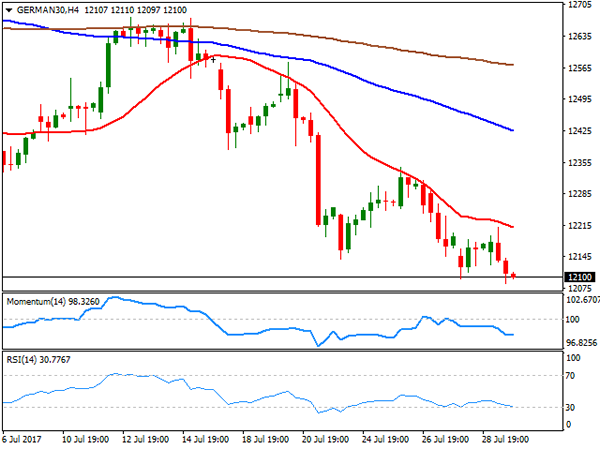
European equities closed mostly lower in the last trading day of July, losing ground ahead of the close. The German DAX settled at 12,118.25, down 44 points, weighed by EUR’s strength, as the common currency reached a fresh 2017 beyond the 1.1800 figure. In June, the index lost 1.7%, mostly due to the sharp appreciation of the local currency, which added 5 cents against the greenback in the same period. Utilities led the way higher, with RWE AG up 1.53% and E.ON up 1.39%. Deutsche Bank led the way lower, losing 2.15%, while the automotive sector remained under pressure, with Volkswagen closing down 1.04% and Daimler shedding 0.86%. The daily chart shows that DAX remains near its lowest since late May, and poised to extend its decline, as technical indicators extended their declines within bearish territory, now nearing oversold territory, whist the 20 DMA extends below the 100 DMA. In the 4 hours chart, the index is also biased lower, with an early advance contained by a bearish 20 SMA, and technical indicators also heading south near oversold readings.
Support levels: 12,085 12,041 12,003
Resistance levels: 12,143 12,199 12,235