
The HKD/JPY exchange rate has been declining within a falling wedge pattern since the beginning of July.
From a theoretical perspective, it is likely that the currency pair could continue to trade downwards within the given pattern until the end of July. Then, a breakout north could occur, and the pair could target the Fibo 50.00% at 13.98.
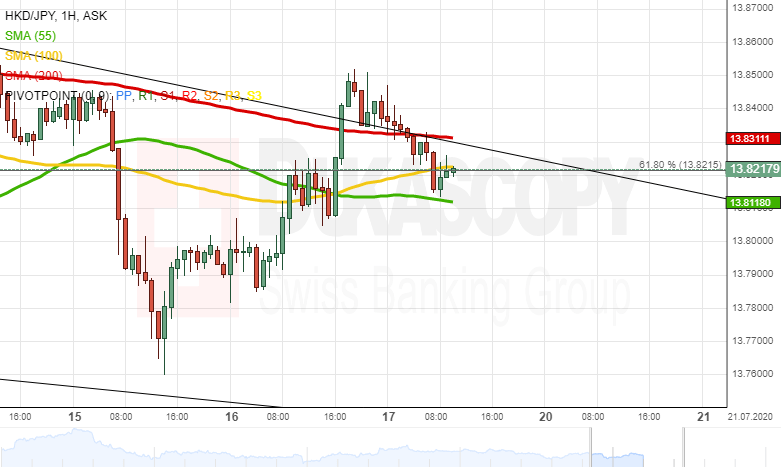
However, note that the exchange rate is pressured by the 55-, 100– and 200-hour SMAs in the 13.80 area. Thus, it is likely that some downside potential could continue to prevail in the market. In this case the rate could gain support from the monthly S1 at 13.69.


