EUR/USD
The EUR/USD pair settled lower this Tuesday, but not far below a fresh 2017 high of 1.1845, on a pretty busy macroeconomic day. Data coming from both economies was mixed, with some ups and some downs, nothing however, defining. In the EU, preliminary Q2 GDP came as expected at 06%, up from a previously revised 0.5%, recording the strongest annual growth in six years. The final Markit manufacturing PMI for the region index came in at 56.6 from a flash estimate of 56.8 and June final reading of 57.4, growing at a slower pace, but still indicating expansion in the region.
In the US, personal spending decreased by 0.1% in June, while incomes remained flat when compared to a month earlier, although the PCE index, brought some relief to the greenback posting an annual growth of 1.4%, whilst the core figure resulted at 1.5%, matching previous, but above the expected 1.3%. Given the poor quarterly released attached to GDP last Friday, the inflation component was almost dollar’s supportive. More relevant, the ISM manufacturing PMI for July ended at 56.3, down from previous 57.8, a sign of steady growth in the country.
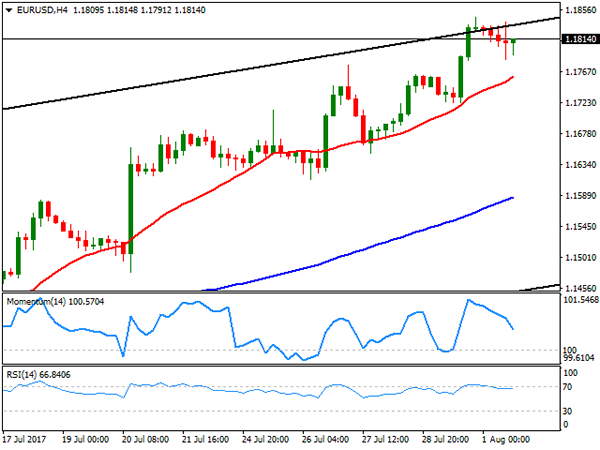
From a technical point of view, the 4 hours chart shows that the pair remained contained below the roof of the ascendant channel, but above bullish moving averages, with the 20 SMA currently around 1.1760. The Momentum indicator pulled sharply lower from overbought territory, while the RSI indicator also heads modestly lower, but holding around 65, yet given the shallow price retracement, chances remain towards the upside, with a bullish breakout of the daily high favoring an extension towards 1.1900 and beyond for this Wednesday.
Support levels: 1.1780 1.1750 1.1715
Resistance levels: 1.1845 1.1870 1.1910
USD/JPY
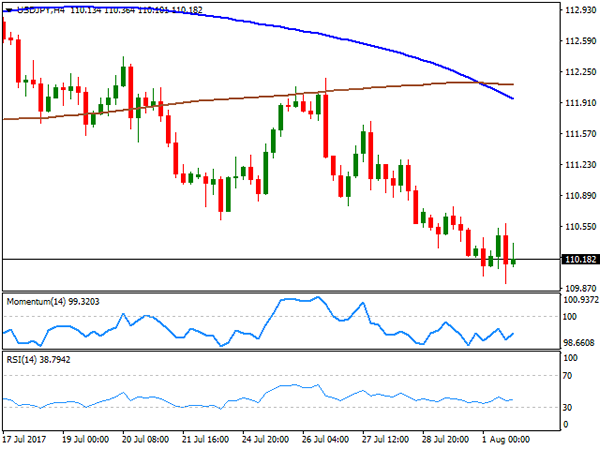
The USD/JPY pair fell for a third consecutive day, reaching a daily low of 109.91 before settling a few pips above the 110.00 threshold, its lowest settlement since mid June. The pair took little cues from US mixed data, lead mostly by a decline in US Treasury yields. After struggling around their Friday’s closing levels, yields turned south this Tuesday, with the 10-year note benchmark down to 2.26% from previous 2.29%. Japan will release its July consumer confidence index for July during the upcoming Asian session, expected at 43.6 from previous 43.3. The pair has been posting lower lows and lower highs daily basis since July 26th, which keeps the risk towards the downside. In the shorter term, and according to the 4 hours chart, the risk is also towards the downside, given that the 100 SMA has crossed below the 200 SMA well above the current level, while technical indicators hover directionless within negative territory. June’s low of 108.80 is still a possible bearish target, with speculative interest probably taking some profits out of the table once reached.
Support levels: 109.90 109.40 108.80
Resistance levels: 110.35 110.80 111.20
GBP/USD
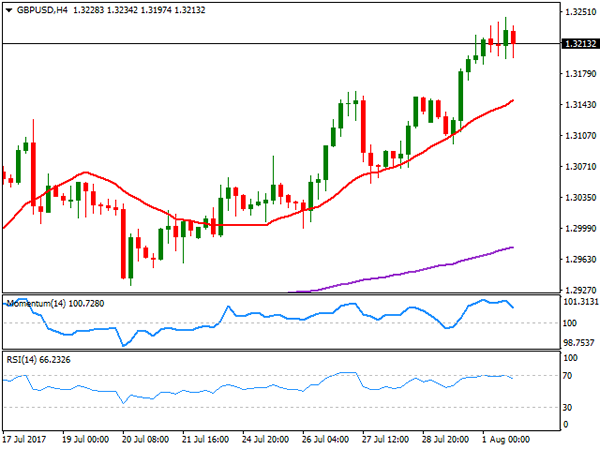
The GBP/USD pair maintained the positive tone, extending its advance up to 1.3243 in a mixture of dollar’s weakness and strong local data. The UK manufacturing sector grew at a faster-than-expected pace in July, with the Markit PMI up to 55.1 in the month, beating expectations of 54.3 and above previous 54.2, boosted by stronger inflows of new work, higher levels of production, improved job creation, longer supplier delivery times and a slight increase in inventory holdings, according to the official report. Intraday pullbacks met buying interest at the 1.3190 region, the immediate support, with the downward potential limited to a corrective movement, as in the 4 hours chart, technical indicators are retreating modestly from overbought territory, whilst the price remains firmly above a bullish 20 SMA. Additional gains beyond the mentioned daily high will have an immediate target at 1.3280, where the pair presents multiple daily highs from last August, with a break above it favoring an extension pass 1.3300.
Support levels: 1.3190 1.3150 1.3120
Resistance levels: 1.3245 1.3280 1.3310
GOLD
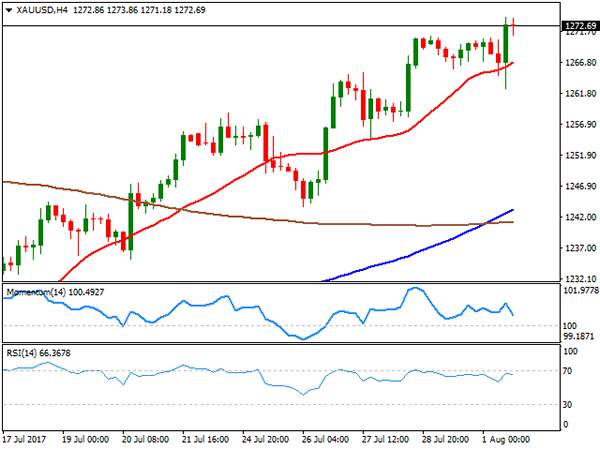
Gold prices extended their advances to near 2-month highs, with spot settling at $1,272.80 a troy ounce, not far from a daily high of 1,274.04. The bright metal gained most ground during the US session, as despite not negative, US data released earlier on the day failed to back the case for another rate hike ahead. Also, backing the advance of the metal were easing equities at the end all of the day, as despite closing in the green, US indexes spent most of the session retreating from their early peaks. Spot’s daily chart shows that it’s still biased north, extending further its advance above all of its moving average, and with the shortest gaining upward momentum well below the current level, whilst technical indicators present a neutral-to-bullish stance within overbought territory. In the 4 hours chart, the price remains above a bullish 20 SMA, with a short-lived slide below it being quickly reverted, and technical indicators retreating within positive territory, hardly enough to confirm a downward move.
Support levels: 1,266.90 1,257.30 1,246.40
Resistance levels: 1,274.05 1,283.30 1,290.10
WTI CRUDE OIL
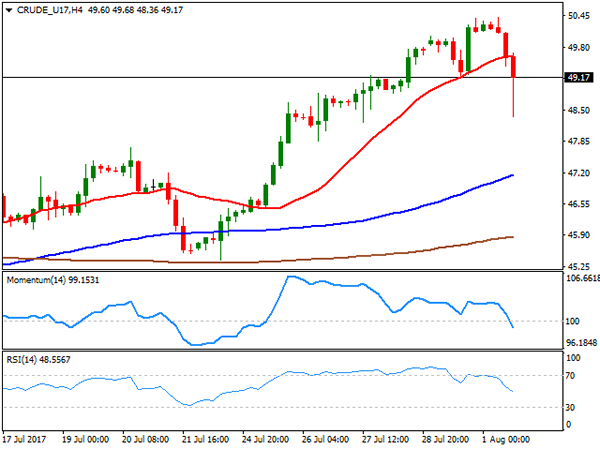
West Texas Intermediate crude oil futures advanced up to $50.41 a barrel at the beginning of the day, but ended the day lower around 49.15, on another report indicating that OPEC’s output rose in July, despite the organization output cut deal. After Reuters reported a 90,000 barrels per day increase on Monday, Bloomberg estimated this Thursday that the cartel’s output rose by 210,000 barrels a day, while Petro-Logistics said the producer group’s output was up by 145,000 barrels a day last month. Ahead of the US stockpiles reports, WTI plunged to 48.36 intraday, retreating from its 200 DMA in the daily chart after flirting with it late Monday, whilst technical indicators in the same chart have turned sharply lower from overbought readings. Still, the price holds above its 20 and 100 SMAs, with the shortest maintaining its bullish slope. In the 4 hours chart, the commodity has turned short-term bearish as technical indicators head south within negative territory, whilst the price broke below a now flat 20 SMA.
Support levels: 48.80 48.30 47.70
Resistance levels: 49.60 50.20 50.85
DJIA
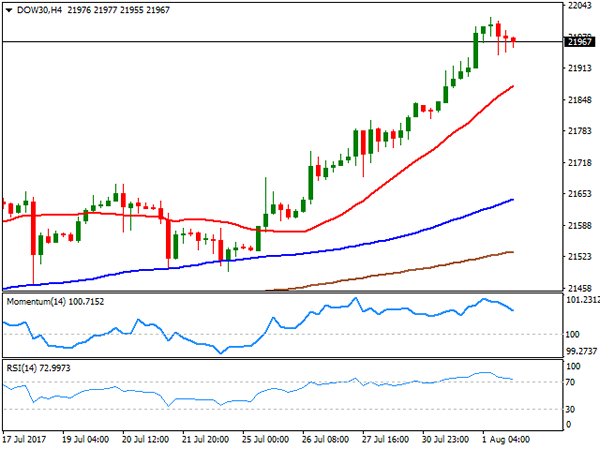
US indexes closed in the green, with the Dow Jones Industrial Average reaching an all-time intraday high of 22,018 early session, and settling at 21,963.92, up 72 points or 0.33%. The Nasdaq Composite added 14 points, to settle at 6,362.94, while the S&P gained points to 2,476.35. Within the Dow, Intel Corp was the best performer up 2.48%, followed by Chevron that added 1.46%. Boeing was the worst performer, down 1.25%, followed by Caterpillar that shed 0.75%. Up for a sixth consecutive session , the daily chart for the Dow shows that the RSI indicator advanced further within overbought territory, currently heading north around 74, whilst the Momentum indicator keeps consolidating well above its mid-line, lacking upward strength. In the same chart, the 20 DMA has accelerated its advance, but stands well below the current level, around 21,660. In the 4 hours chart, technical indicators are easing from extreme oversold readings, but the RSI indicator remains above 70, while the 20 SMA advanced further below the current level, all of which maintains the risk towards the upside for the upcoming sessions.
Support levels: 21,940 21,895 21,841
Resistance levels: 21,977 22,030 22,070
FTSE100
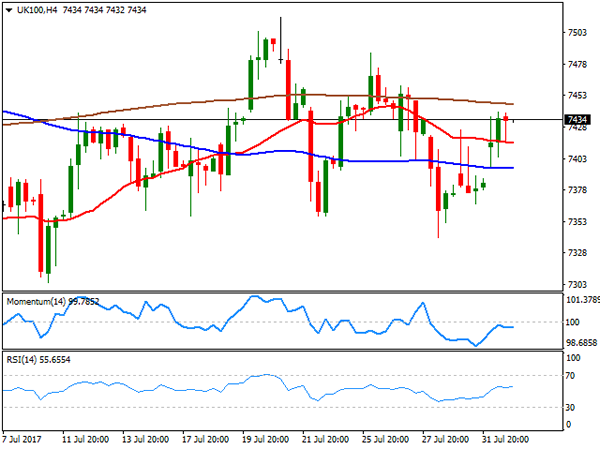
The FTSE 100 closed at 7,423.66, up 52 points this Tuesday, boosted by a positive mood among investors, and strong earnings reports. Rolls Royce was the best performer, up 10.25% after the company reported a 12% raise in revenues to £7.57bn for the first six months of the year, helped by a 27% increase in large engine deliveries. Intertek Group followed, up 9.16% on news that its half-year profits rose more than 20% to £210.3m. Fresnillo was the worst performer, down 2.60%, followed by Mediclinic International that shed 2.03%. The index recovered above its 20 and 100 SMAs in the daily chart, but remains previous highs and with moving averages still lacking directional strength, mostly in a consolidative phase. Technical indicators in the mentioned chart stuck around their mid-lines, also confirm the neutral stance. In the shorter term, and according to the 4 hours chart, the index continues developing between horizontal moving averages, whilst technical indicators continued recovering from near oversold levels before turning flat right below their mid-lines, in line with the longer term perspective.
Support levels: 7,340 7,294 7,257
Resistance levels: 7,440 7,587 7,610
DAX
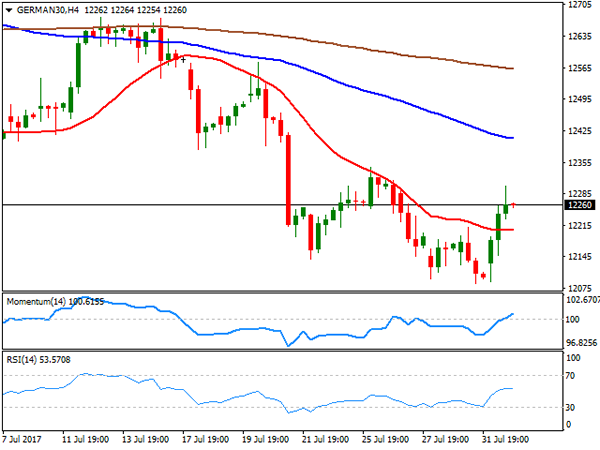
The German DAX added 134 points or 1.10%, to close at 12,251.29, backed by solid local growth reports and the positive momentum among Asian equities. According to Markit, German manufacturing remained in a strong expansionary phase at the start of the second half of 2017, with the PMI printing 58.1 in July, slightly below previous. The best performer was Deutsche Lufthansa, up 3.30%, followed by E.ON that gained 2.79%. Only two members closed lower, Adidas that lost 0.62% and Merck, which closed down 0.61%. In the daily chart, the index remains well below its 20 and 100 DMAs, with the shortest extending below the larger, while technical indicators are barely bouncing from oversold territory, not enough to indicate a steadier recovery ahead. In the 4 hours chart, the upside looks a bit more constructive, as the index settled above its 20 SMA, whilst the Momentum indicator heads north above its 100 level and the RSI consolidates around 53.
Support levels: 12,215 12,161 12,120
Resistance levels: 12,302 12,347 12,383