In this Technical blog we are going to take a quick look at the past 1 hour Elliott Wave performance of Dow E-Mini Future (YM_F ) cycle from June 19 peak, which we presented to our clients at elliottwave-forecast.com. We are going to explain the structure from that cycle.
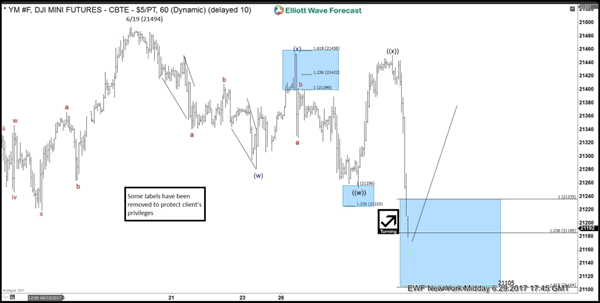
Dow E-mini Future 1 Hour Elliott Wave Chart from June 29
The cycle from May low April 19,2017 low has ended in the index at June 19 peak (21494). Below from there index was correcting the April cycle & expected to find buyer’s in 3 or 7 swings for further upside in the index. The structure from the peak looks to be overlapping, hence suggested that it’s a corrective structure from the peak. Where First leg lower ended i.e. Minute wave ((w)) at (21297) & Minute wave ((x)) ended at (21497) and 21235-21185 100%-123.6% extension area was expected to find buyer’s in the index for more upside or for a 3 wave bounce at least.
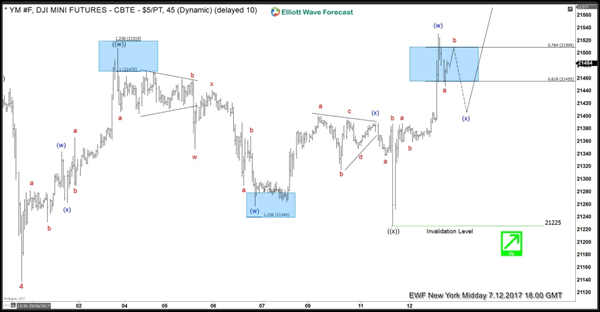
Dow E-mini Future 1 Hour Elliott Wave Chart from July 12
Then the index found the dip again at 21225 low in Minute wave ((x)) as expected in 3 swings and resume the next leg higher in the index towards 21600-21688 100%-123.6% fibonacci extension area of previous ((w))-((x)) to end the cycle from June 29 low (21137) and to start the Minor wave X correction. ( Note we adjusted some degree of labeling on the chart to align with higher degree time frames).
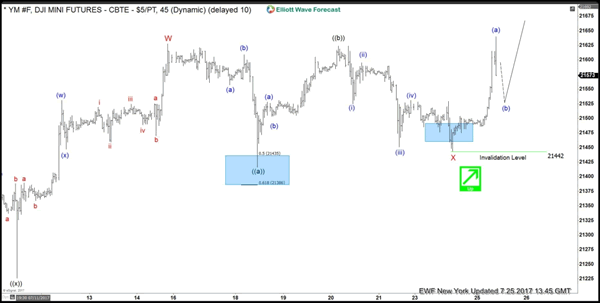
Dow E-mini Future 1 Hour Elliott Wave Chart from July 25
The index ended the cycle from June 29 low in Minor wave W higher at 21676 peak and also finished correcting that cycle in Minor wave X at 21442 low as Regular flat structure and above from there and more importantly as far as the pivot from June 29 low stayed intact was expected to resume the upside in Minor Y leg higher to complete the 7 swings structure from June 29 low (21137).
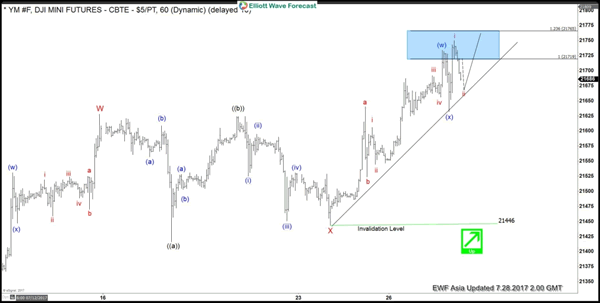
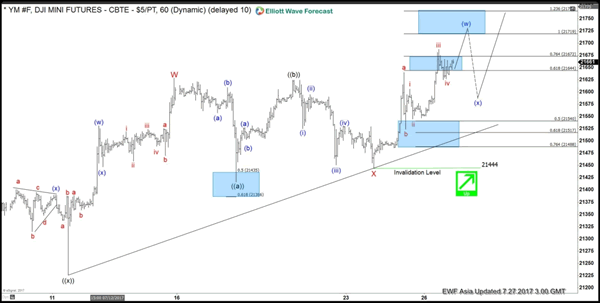
Dow E-mini Future 1 Hour Elliott Wave Chart from July 27
As the dips remained above 21444 low index broke to new highs suggesting the next leg higher has started in the index & so the near term focus remained towards 21719-21769 area to start the 3 waves back in the index within Minutte wave (x) before further upside was seen.
Dow E-mini Future 1 Hour Elliott Wave Chart from July 28
Then the index did a shallow connector in Minutte wave (x) pullback at 21632 and resume higher as expected and now has already reached the 100%-123.6% fibonacci extension area at 21933-22049 target area from June 29 low in 7 swings target area from the longs we had from June 29 low.