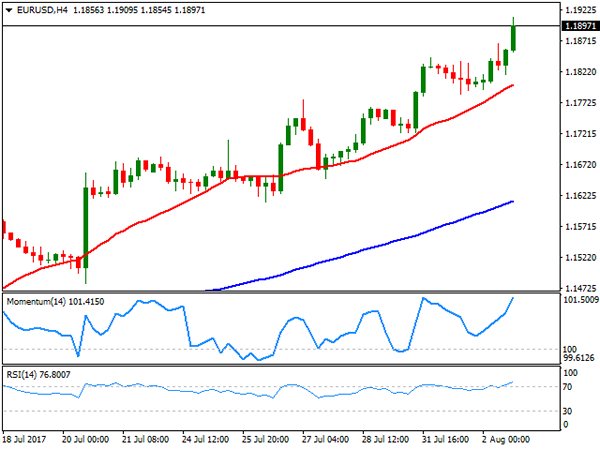
EUR/USD
The EUR/USD settled at a fresh 2017 high right below the 1.1900 level and after posting 1.1909, as soft US data coupled with dovish comments from Fed’s members. Trading was choppy across the board during the first half of the day, but the dollar had no chances, particularly after the release of a neutral US ADP survey, as July job’s creation came in below expected at 178K, although June’s figures was upwardly revised to 191K. The EU macroeconomic calendar was quite light, with only the release of industrial producer prices, down by 0.1% in June, in-line with market’s expectations, and modestly up yearly basis to 2.5%, anyway supportive for ECB’s tightening. In the US, Fed’s Bullard expressed his concerns about soft inflation, saying that he doesn’t support further hikes in the near term, not actually a surprise as he belongs to the doves’ team, whilst Loretta Mester, reiterated her support for gradual hikes, but said that it could take a couple of months to see an uptick in local inflation.
The undeniable upward momentum persists heading into the Asian opening, as in the 4 hours chart, the 20 SMA continues leading the way higher, providing a dynamic support now at 1.1800, whilst technical indicators accelerated north, entering overbought territory and at fresh weekly highs. The market may enter in wait-and-see mode on Thursday after the release of services and composite PMIs in the EU and the US and ahead of the US Nonfarm Payroll report, with dips still seen as buying opportunities.
Support levels: 1.1845 1.1800 1.1765
Resistance levels: 1.1910 1.1950 1.1990
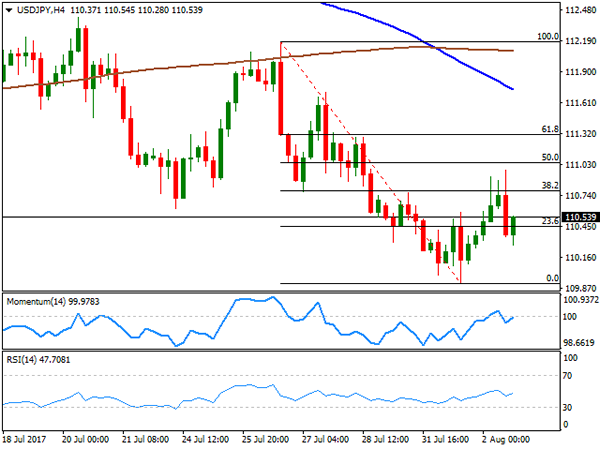
USD/JPY
The USD/JPY pair neared 111.00 early US session, backed by a positive mood among stocks’ traders, steady yields, and the US ADP employment survey, which was short of disappointing investors. The US private sector added 178,000 new jobs in July, slightly below the 185K expected, while June’s figure was revised higher from 158K to 191K, whilst the Dow Jones Industrial Average traded beyond 22,000 for the first time ever on strong earnings reports. The USD/JPY pair, however, changed course in the US afternoon, trimming most of its daily gains, on dovish comments from Fed’s officers, concerned on inflation and further limiting chances of further rate hikes in the US. The 4 hours chart shows that the price retreated after failing to settle above the 38.2% retracement of its latest decline between 112.18 and 109.91 around 110.80, now the immediate support, whilst the 100 SMA extended its decline below the 200 SMA, both far above the current level, as technical indicators hover around their mid-lines with no clear directional strength. Overall, the risk remains towards the downside, with a break below 109.90 required to confirm a new leg lower towards 108.80.
Support levels: 109.90 109.40 108.80
Resistance levels: 110.35 110.80 111.20
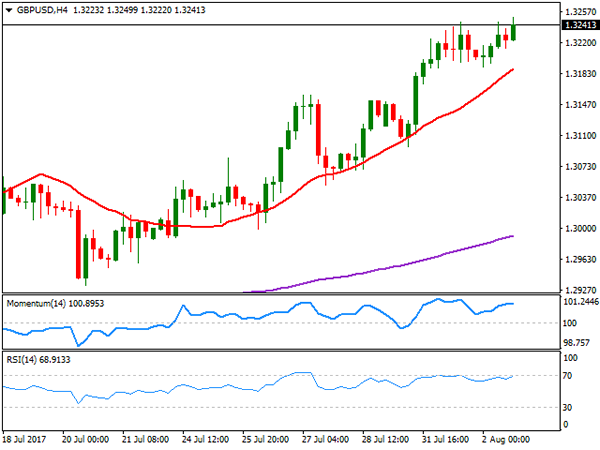
GBP/USD
The GBP/USD pair extended its advance by a few pips this Wednesday, settling at 1.3241, after printing 1.3250 in the US afternoon. Pound gains were limited by a soft UK macroeconomic figure, as the construction PMI resulted at 51.9 in July from 54.8 in June, amid lower volumes of commercial building and a softer expansion of housing activity, according to Markit. Sterling’s fate will be determinate by the BOE, as the Central Bank will unveil its latest monetary decision, alongside with fresh economic forecast this Thursday. No changes in rates or the APP are expected, but market will be looking at how policymakers vote on a possible move, as latest inflation data, has gave Carney’s doves a breath. The pair is overbought daily basis, although in the short term, there’s still room to go, given that in the 4 hours chart, the 20 SMA maintains its strong bullish slope below the current level, whilst technical indicators consolidate well above their mid-lines. Pullbacks towards 1.3190, Tuesday’s low will probably attract buying interest, although a break below it on BOE’s outcome, could see the pair reaching 1.3120. Above 1.3260, on the other hand, the bullish momentum will likely accelerate driving the pair beyond the 1.3300 threshold.
Support levels: 1.3190 1.3150 1.3120
Resistance levels: 1.3260 1.3310 1.3350
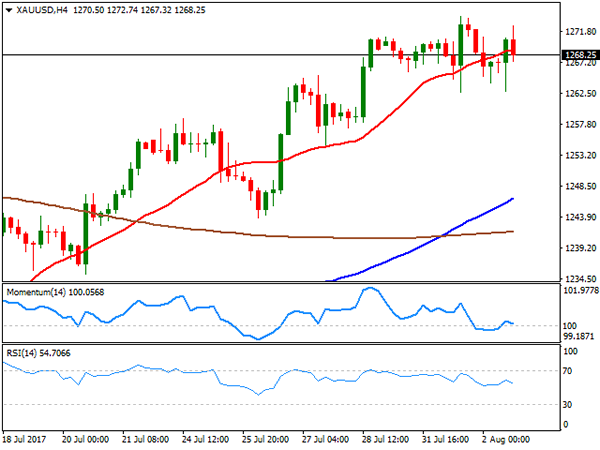
GOLD
Spot gold ended little changed this Wednesday at $1,268.27 a troy ounce, down at the beginning of the day on soft physical demand in Asia. The commodity bounced back after the US opening as comments from Fed officers triggered concerns over US monetary policy, with the market now doubting on a third rate hike this year. Strong demand for riskier assets, limited gains, although spot holds at near two months highs. In the daily chart, the price remains well above all of its moving averages, with the 100 DMA still horizontal, with the 20 DMA accelerating north below it, and technical indicators in the mentioned chart retreating from overbought levels, supporting a downward corrective movement ahead on a break below 1,262.63, the weekly low and the immediate support. In the 4 hours chart, the price is currently hovering around a bullish 20 SMA, whilst technical indicators head south within neutral territory, indicating an increasing downward potential and in line with the longer term perspective.
Support levels: 1,263.65 1,257.30 1,246.40
Resistance levels: 1,274.05 1,283.30 1,290.10
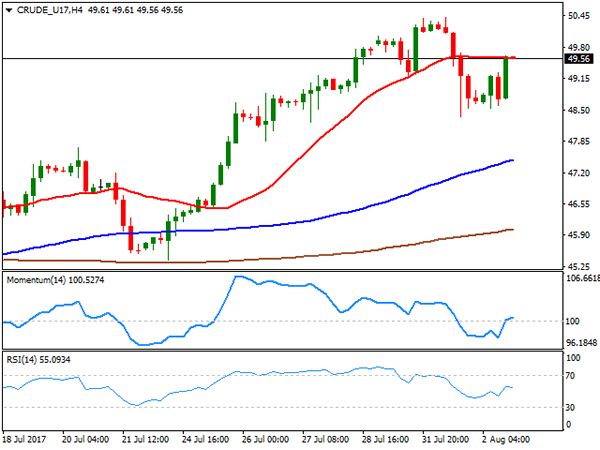
WTI CRUDE OIL
Crude oil prices recovered some ground this Wednesday, with West Texas Intermediate crude futures settling at $49.57 a barrel, despite disappointing US inventories´ data. Late Tuesday, the API reported an inventory build of 1.779 million barrels, while according to the EIA, stockpiles fell by 1.5 million in the week ended July 28th, nearly half market’s expected decline of 2.96 million. The commodity fell as an immediate reaction to the news, but changed course amid broad dollar’s weakness. The daily chart shows that the price continues trading between its 100 and 200 SMAs, while technical indicators have managed to recover modestly within positive territory, indicating that bulls are still in the driver’s seat. In the 4 hours chart, the commodity pared gains around a horizontal 20 SMA, while technical indicators reached their mid-lines before losing directional strength, not enough to confirm further gains, but surely converging with the longer term perspective.
Support levels: 48.80 48.30 47.70
Resistance levels: 50.20 50.85 51.40
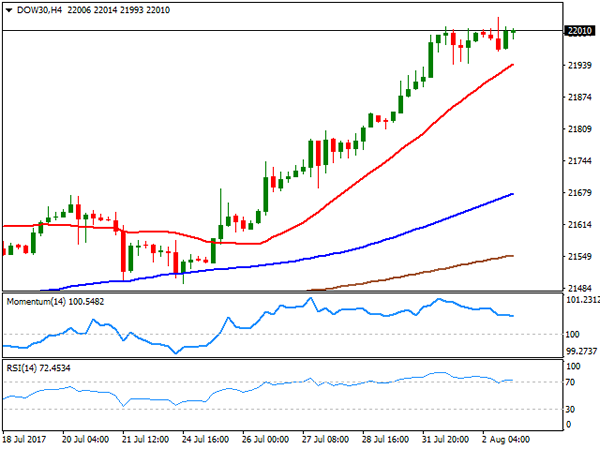
DJIA
The Dow Jones Industrial Average closed at 22,016.04, up 52 points and above the 22,000 level for the first time ever, after Apple’s latest resulted pushed the technology sector higher. The S&P advanced just 1 point, to settle at 2,477.57, while the Nasdaq Composite closed flat at 6,362.65. Apple was the best performer, up 4.99% after the company reported late Tuesday a quarterly revenue of $45.4 billion and quarterly earnings per diluted share of $1.67. Walt Disney Co. led decliners, ending the day 1.93% lower, followed by Verizon that shed 1.60%. The Dow maintains its bullish stance, despite technical indicators in the daily chart are heading north within overbought territory, whilst the 20 SMA accelerated its advance below the current level. In the shorter term, and according to the 4 hours chart, the Momentum indicator diverges south, retreating from overbought readings, whilst the RSI indicator holds around 72, whilst the 20 SMA extended its advance below the current level, all of which favors a continued advance for this Thursday.
Support levels: 21,993 21,940 21,895
Resistance levels: 22,036 22,080 22,140
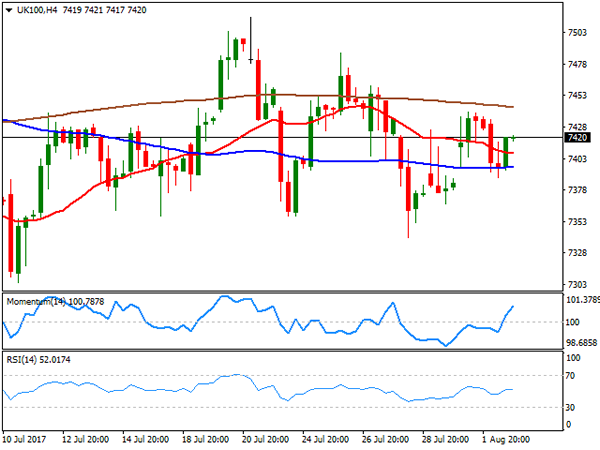
FTSE100
The FTSE 100 continues lacking directional strength, settling at 7,411.43, up 12 points or 0.16% this Wednesday, undermined by persistent strength in the Pound and a decline mining-related equities. Rio Tinto dragged the sector lower, despite reporting healthy profits, after warning that metal prices are likely to remain volatile for the rest of the year. Shares for the company closed 2.83% lower. Standard Chartered was the worst performer, shedding 6.05%, followed by Rolls-Royce that ended 3.68% lower. Old Mutual led advancers, adding 3.31%. The daily chart for the index presents a neutral stance, as it settled right above still directionless 20 and 100 DMAs, while technical indicators remain flat within neutral territory. In the 4 hours chart, the downward potential seems limited, as the Momentum indicator heads north above its mid-line, although with the index still trapped between modestly bearish moving averages and the RSI indicator flat at 52, little more could be expected at this point.
Support levels: 7,392 7,340 7,294
Resistance levels: 7,440 7,587 7,610
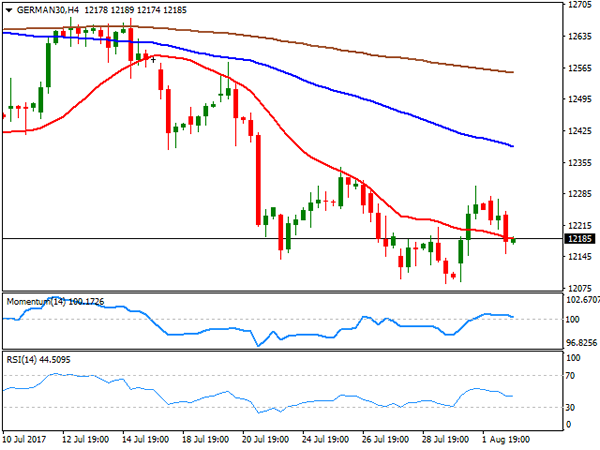
DAX
European equities edged lower, with the German DAX down 69 points to close the day at 12,181.48, weighed by EUR’s strength, and weak banks’ results. In Germany, Deutsche Lufthansa led advancers with a 2.27% gain, followed by Vonovia that added 1.38%. The worst performer was Heidelberg Cement that shed 3.49%, while Commerzbank lost 2.47% and Deutsche Bank ended 1.22% lower. The index seems poised to extend its decline, as in the daily chart, the Momentum indicator maintained and extended its bearish slope, now nearing oversold levels, whilst the RSI indicator resumed its decline, currently around 38. In the same chart, the 20 DMA crossed below the 100 DMA above the current level, reaffirming the negative stance. In the 4 hours chart, the index hovers around a bearish 20 SMA, whilst the Momentum indicator lacks directional strength, hovering around its mid-line, and the RSI indicator hovers around 44.
Support levels: 12,161 12,120 12,084
Resistance levels: 12,245 12,295 12,343