
The EUR/USD currency pair
Technical indicators of the currency pair:
Prev Open: 1.18381
Open: 1.18697
% chg. over the last day: +0.14
Day’s range: 1.18638 – 1.19041
52 wk range: 1.0777 – 1.1781
The US currency continues to lose ground against its main competitors. The greenback is under pressure due to uncertainty concerning a new stimulus package in the US and ongoing tension between Beijing and Washington. Investors expect the FOMC minutes to be published later this week. At the moment, EUR/USD quotes are testing the round level of 1.1900. The 1.1865 mark is already a “mirror” support. The trading instrument has the potential for further growth. Positions should be opened from key levels.
At 15:30 (GMT+3:00), a number of indicators on the US real estate market will be published
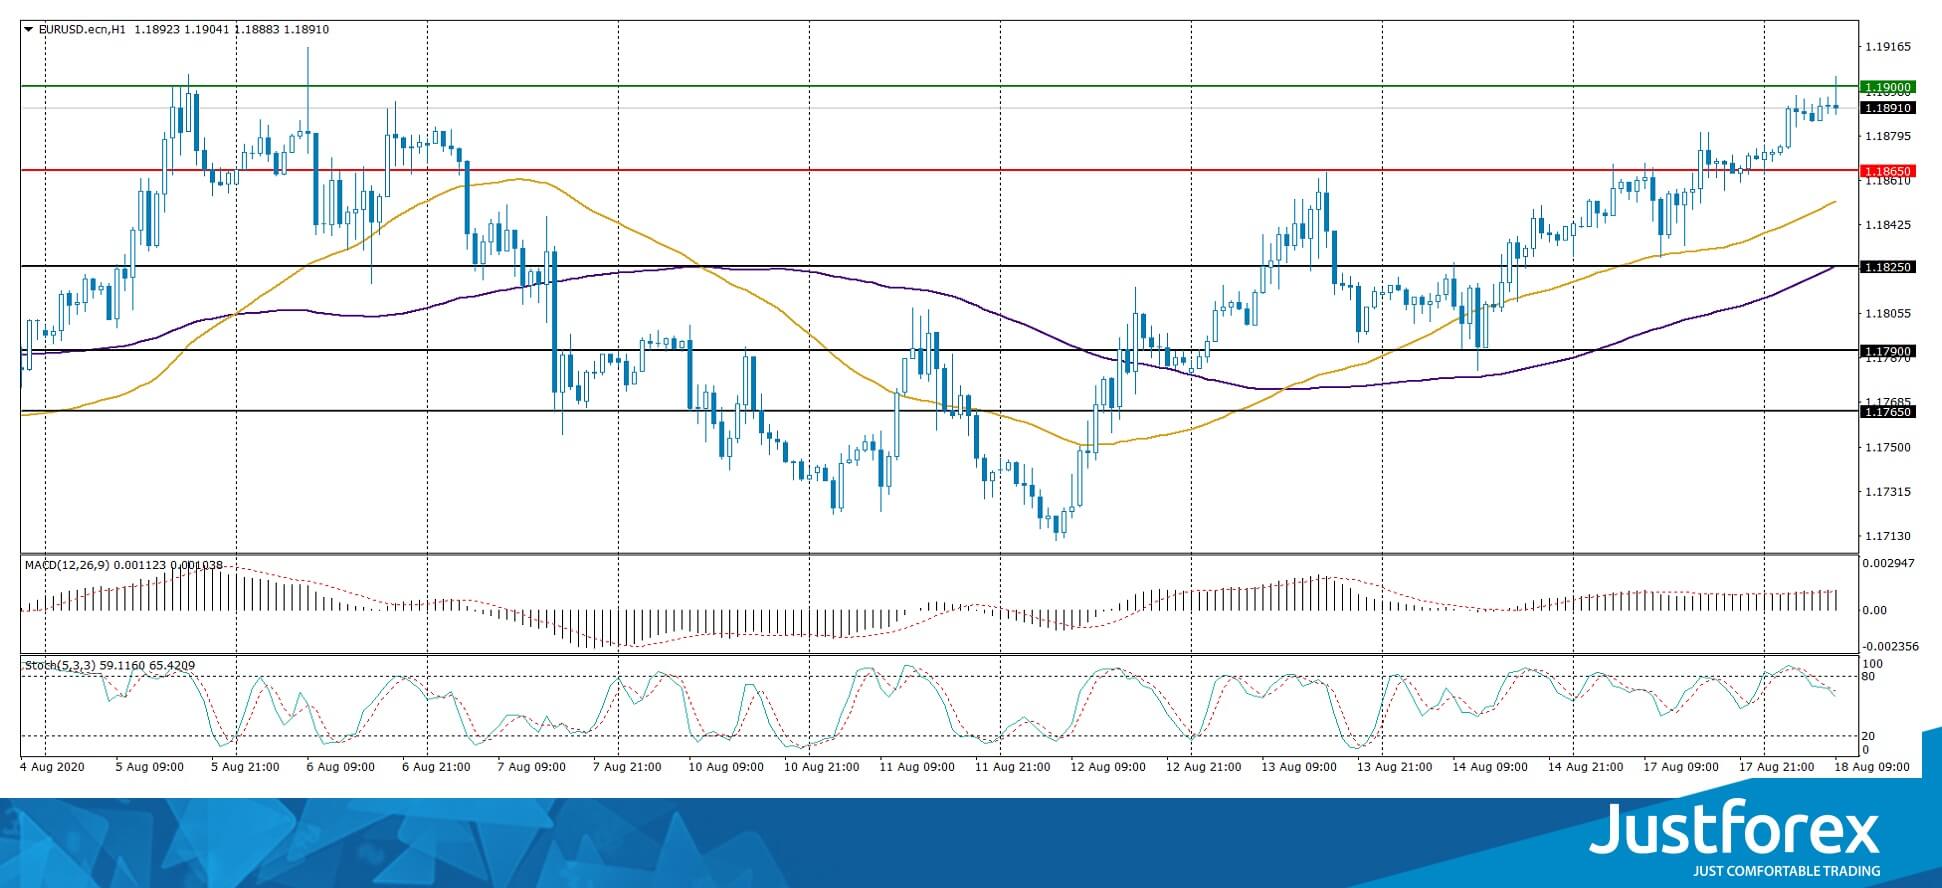
Indicators signal the power of buyers: the price has fixed above 50 MA and 100 MA.
The MACD histogram is in the positive zone, which indicates the bullish sentiment.
Stochastic Oscillator is in the neutral zone, the %K line is below the %D line, which gives a signal to sell EUR/USD.
Trading recommendations
Support levels: 1.1865, 1.1825, 1.1790
Resistance levels: 1.1900, 1.1950
If the price fixes above 1.1900, further growth of EUR/USD quotes is expected. The movement is tending to 1.1940-1.1960.
An alternative could be a decline in the EUR/USD currency pair to 1.1830-1.1810.
The GBP/USD currency pair
Technical indicators of the currency pair:
Prev Open: 1.30910
Open: 1.30985
% chg. over the last day: +0.03
Day’s range: 1.30869 – 1.31678
52 wk range: 1.1466 – 1.3516
The bullish sentiment prevails on the GBP/USD currency pair. The British pound has reached key extremes. At the moment, GBP/USD quotes are testing the supply zone of 1.3165-1.3185. The 1.3125 mark is already a “mirror” support. The demand for greenback is still quite low. The trading instrument has the potential for further growth. Positions should be opened from key levels.
The news feed on the UK economy is calm.
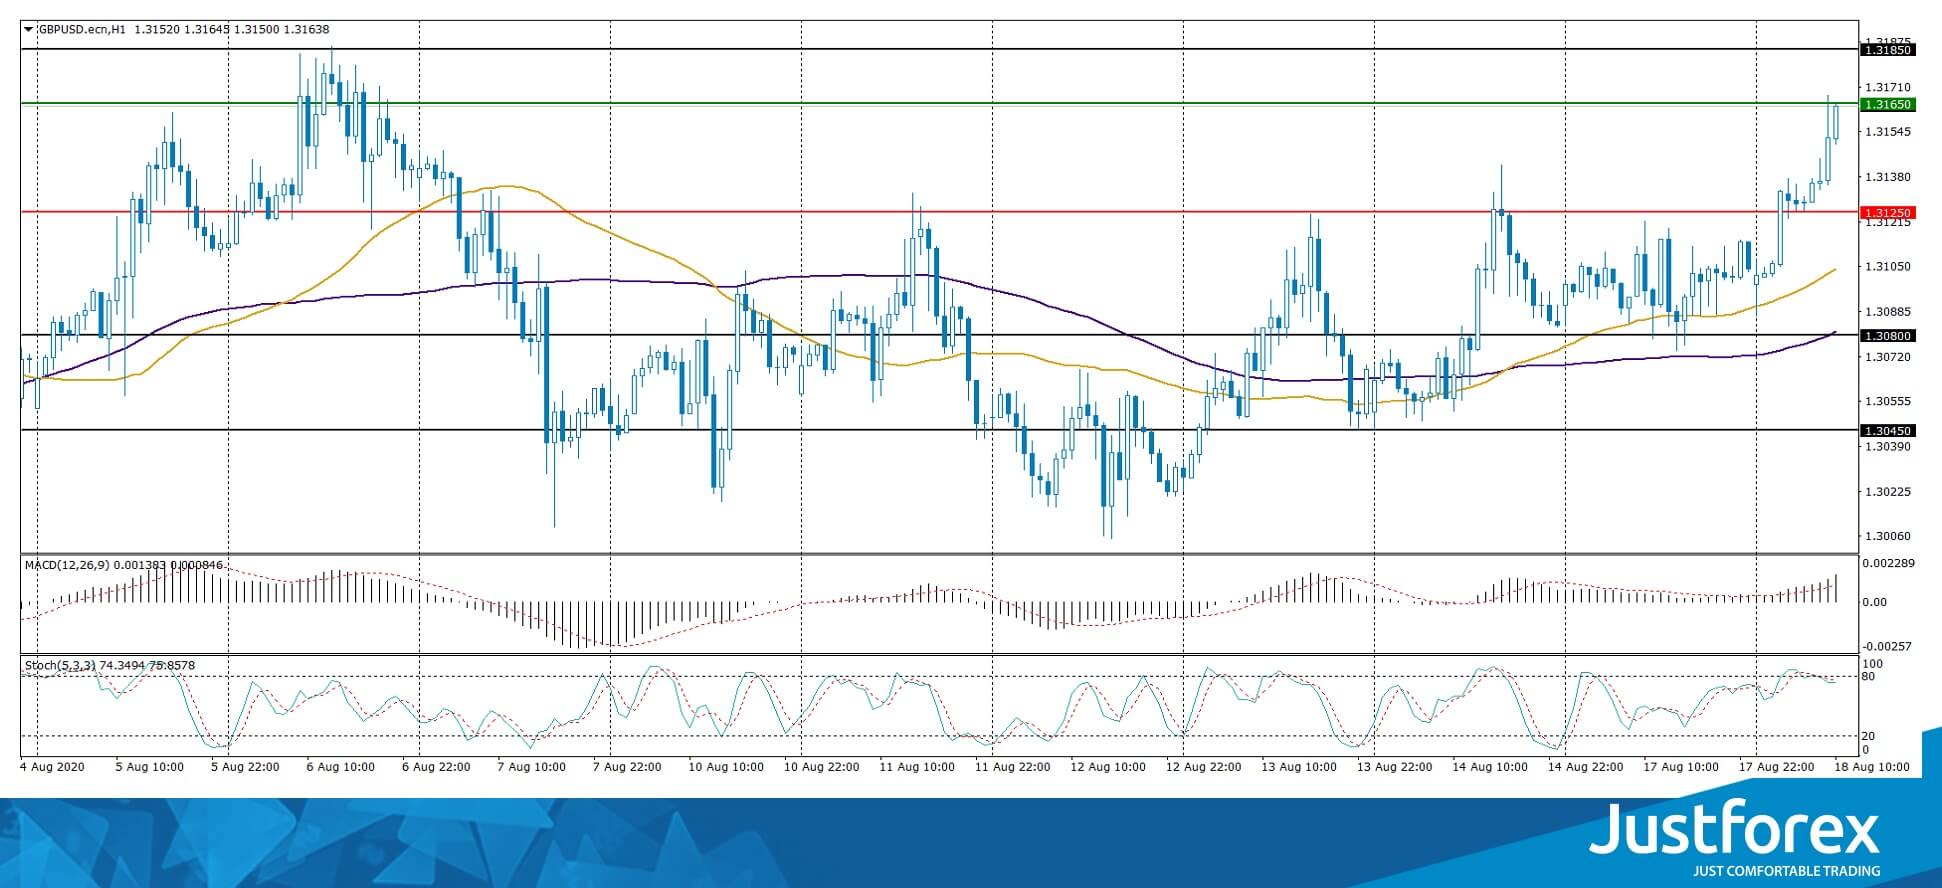
Indicators point to the power of buyers: the price has fixed above 50 MA and 100 MA.
The MACD histogram is in the positive zone, which indicates the bullish sentiment.
Stochastic Oscillator is near the overbought zone, the %K line has crossed the %D line. There are no signals at the moment.
Trading recommendations
Support levels: 1.3125, 1.3080, 1.3045
Resistance levels: 1.3165, 1.3185, 1.3200
If the price fixes above 1.3165, further growth in GBP/USD quotes is expected. The movement is tending to 1.3190-1.3220.
An alternative could be a decline in the GBP/USD currency pair to 1.3090-1.3070.
The USD/CAD currency pair
Technical indicators of the currency pair:
Prev Open: 1.32438
Open: 1.32118
% chg. over the last day: -0.30
Day’s range: 1.31710 – 1.32314
52 wk range: 1.2949 – 1.4668
The USD/CAD currency pair shows a negative trend. The trading instrument has set new local lows. The loonie is currently testing 1.3170. The round level of 1.3200 is the nearest resistance. USD/CAD quotes have the potential for further decline. We recommend paying attention to the dynamics of “black gold” prices. Positions should be opened from key levels.
The news feed on Canada’s economy is calm.
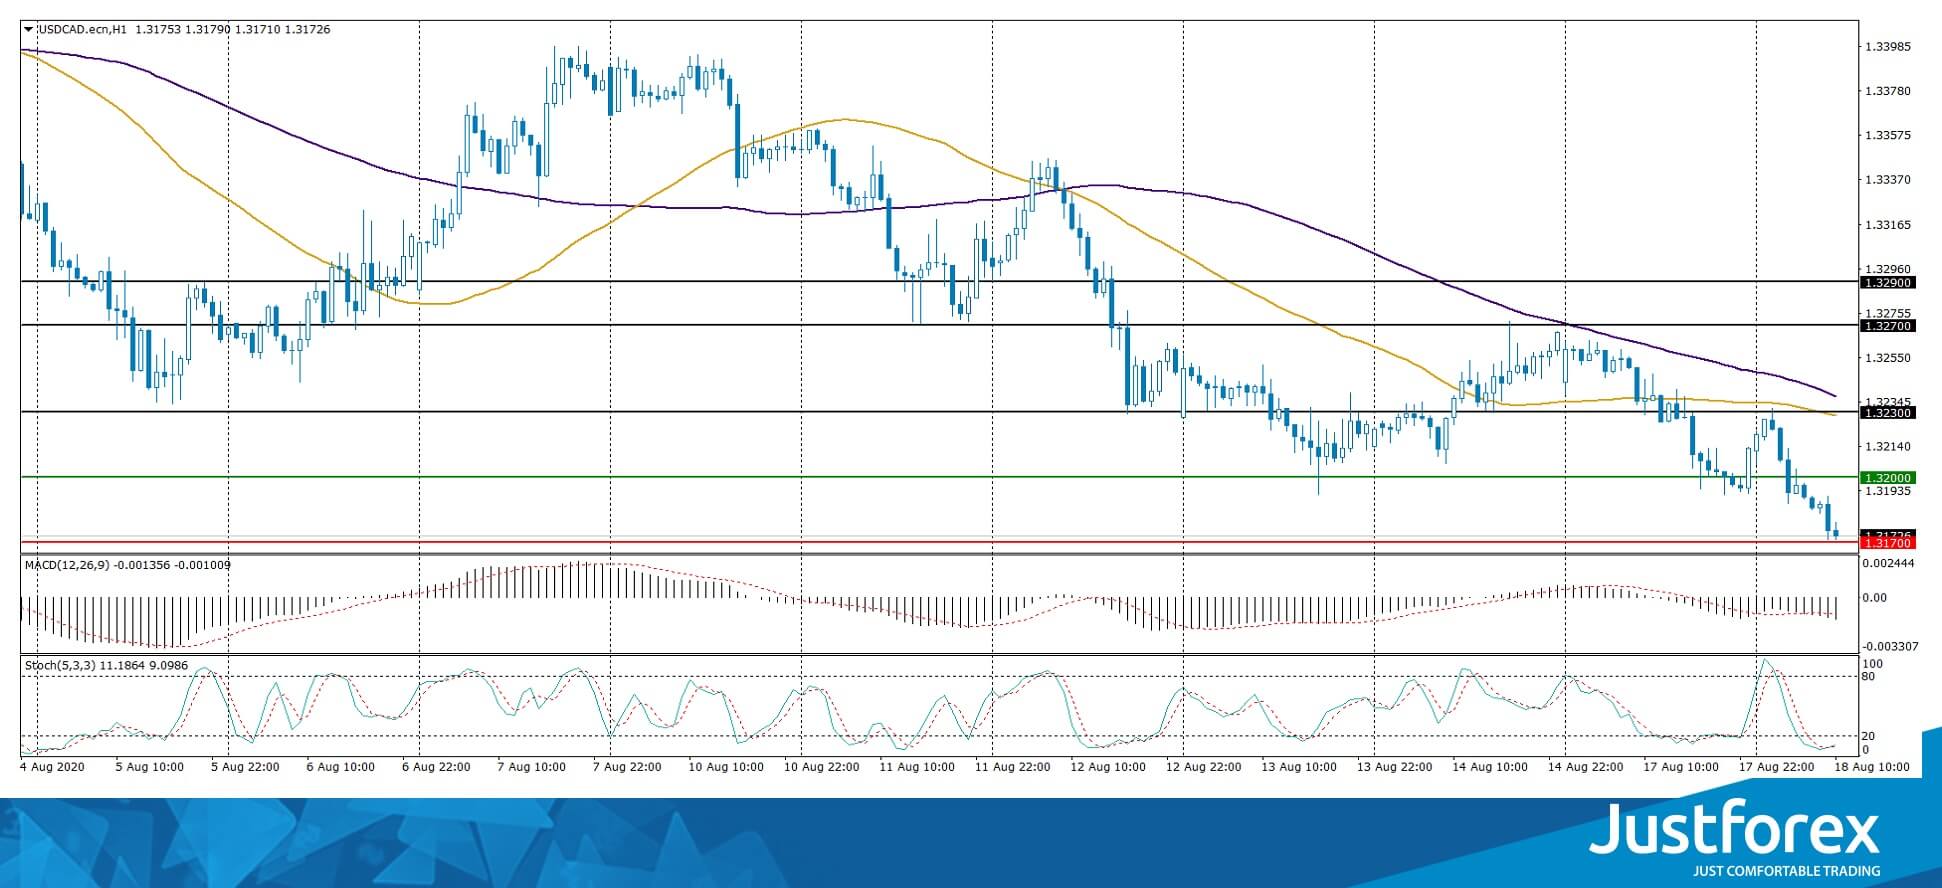
Indicators signal the power of sellers: the price has fixed below 50 MA and 100 MA.
The MACD histogram is in the negative zone, which indicates the bearish sentiment.
Stochastic Oscillator is in the oversold zone, the %K line has crossed the %D line. There are no signals at the moment.
Trading recommendations
Support levels: 1.3170, 1.3130, 1.3100
Resistance levels: 1.3200, 1.3230, 1.3270
If the price fixes below 1.3170, USD/CAD sales should be considered. The movement is tending to 1.3140-1.3120.
An alternative could be the growth of the USD/CAD currency pair to 1.3230-1.3260.
The USD/JPY currency pair
Technical indicators of the currency pair:
Prev Open: 106.564
Open: 106.956
% chg. over the last day: -0.53
Day’s range: 105.402 – 106.051
52 wk range: 101.19 – 112.41
USD/JPY quotes show a pronounced downtrend. The trading instrument has reached key lows. At the moment, the USD/JPY currency pair is testing the support level of 105.40. The level of 105.80 is the nearest resistance. The demand for the US dollar is still quite low. The yen has the potential for further growth against the greenback. Positions should be opened from key levels.
The news feed on Japan’s economy is calm.
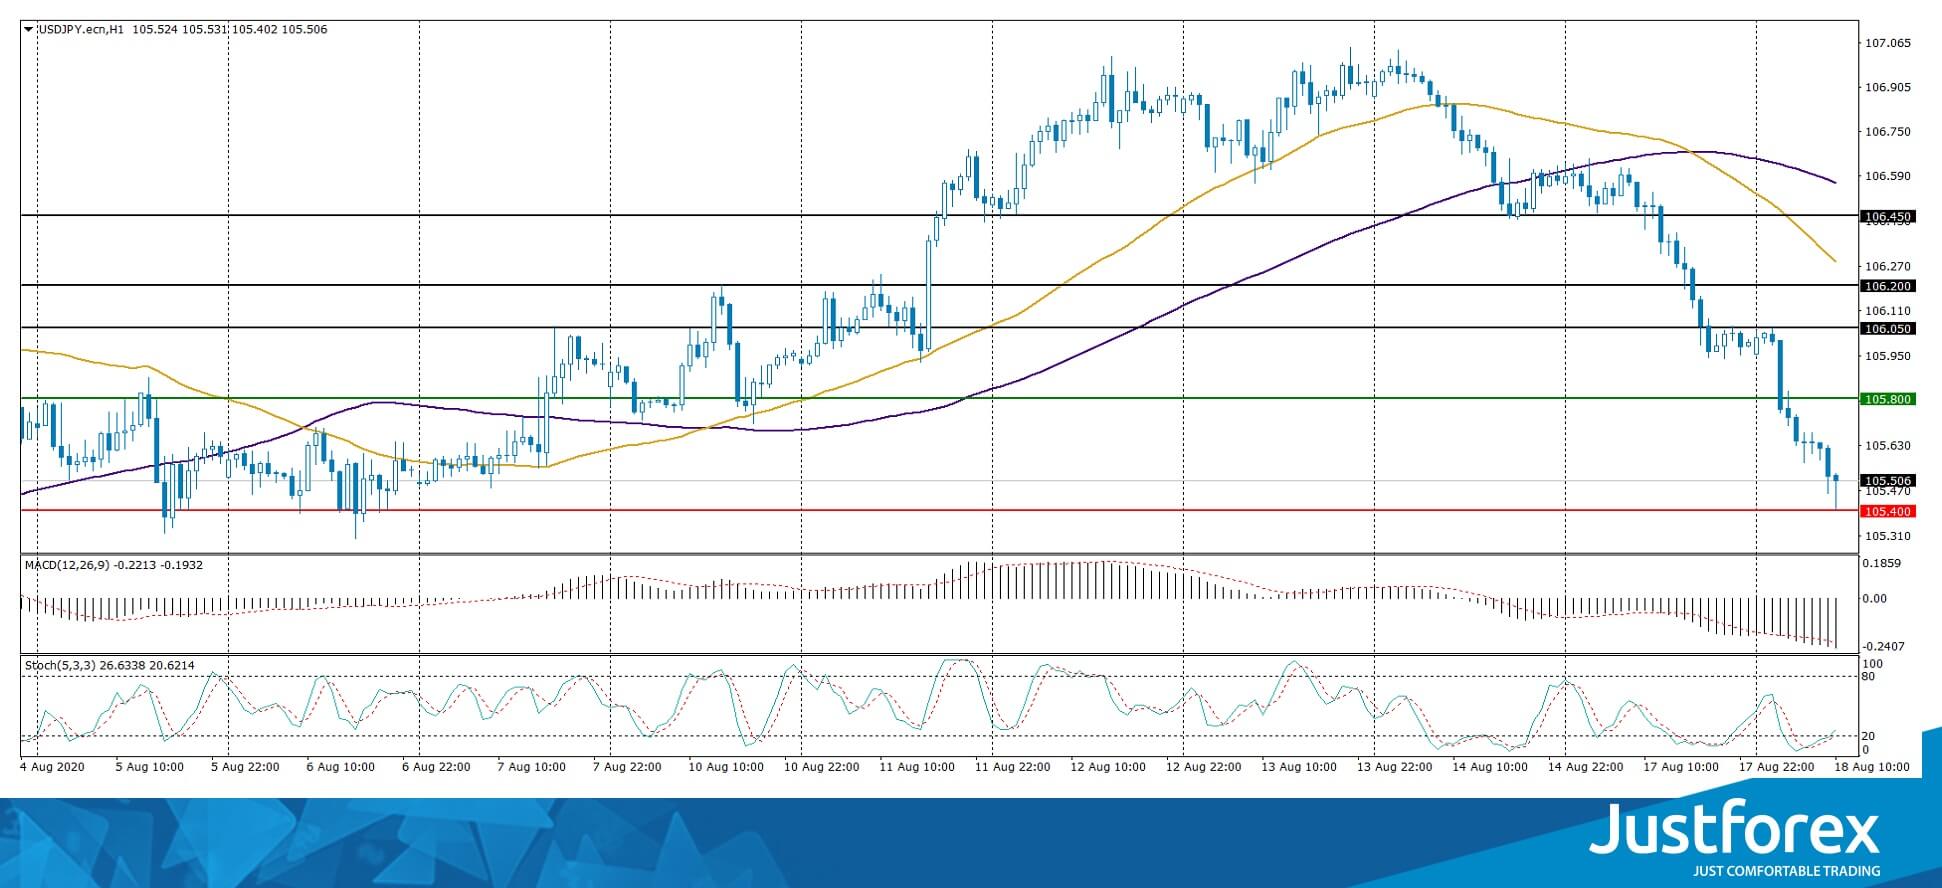
Indicators signal the power of sellers: the price has fixed below 50 MA and 100 MA.
The MACD histogram is in the negative zone, which indicates the bearish sentiment.
Stochastic Oscillator is in the oversold zone, the %K line has crossed the %D line. There are no signals at the moment.
Trading recommendations
Support levels: 105.40, 105.00
Resistance levels: 105.80, 106.05, 106.20
If the price fixes below 105.40, a further drop in USD/JPY quotes is expected. The movement is tending to the round level of 105.00.
An alternative could be the growth of the USD/JPY currency pair to 106.10-106.30.


