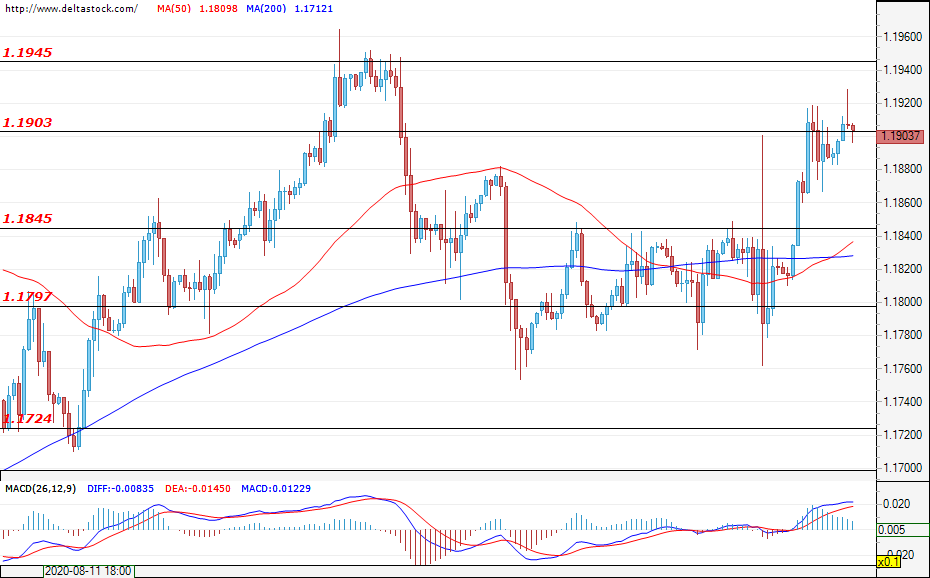
EUR/USD
Current level – 1.1903
During last week’s final trading session, the currency pair managed to leave the narrow range 1.1800-1.1845. Currently, the price is situated just before the resistance zone at 1.1900. A successful breach of this level will encourage the bulls to test the next resistance at 1.1945. In a negative direction, a breakthrough of the lower limit of the mentioned range would be a sufficient reason for the bears to take control. In terms of economic events this week, the focus will be on the ADP Nonfarm Employment Change data (Wednesday; 12:15 GMT), followed by the Non-farm payrolls change data for the U.S. (Friday; 12:30 GMT), as well as the Unemployment rate data for the U.S. (Friday; 12:30 GMT).
| Resistance | Support | ||
| intraday | intraweek | intraday | intraweek |
| 1.1900 | 1.2080 | 1.1845 | 1.1725 |
| 1.1945 | 1.2200 | 1.1800 | 1.1580 |
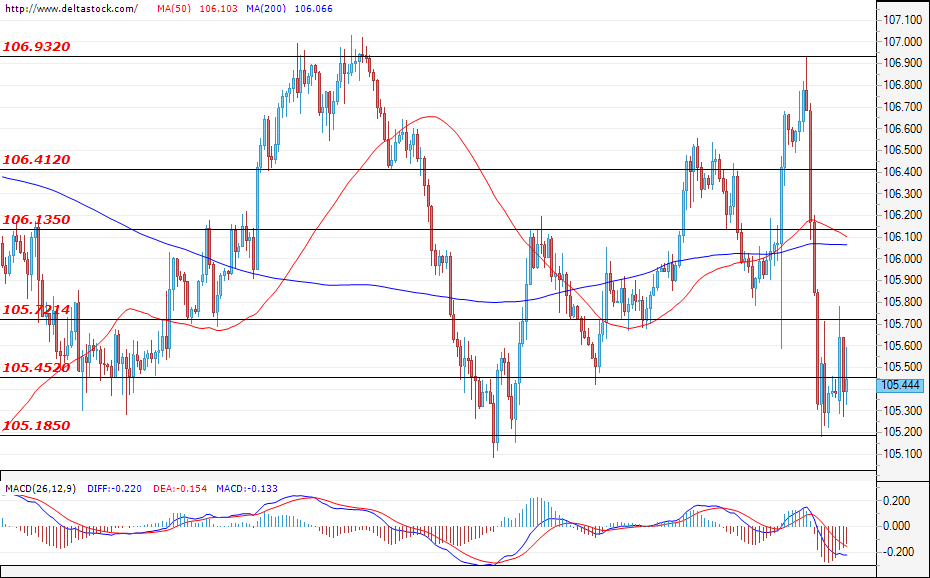
USD/JPY
Current level – 105.44
The dollar lost some ground against the Japanese yen once again after the failed test of the resistance zone at 106.93. For now, the bulls managed to limit the sell-off to 105.20, which is the main support for the currency pair. The unbroken main support and the strengthening of the bearish moods positioned the currency pair in a rather neutral zone for the moment. The economic news, mentioned in the EUR/USD analysis, could lead to an increased volatility of the currency pair during the week.
| Resistance | Support | ||
| intraday | intraweek | intraday | intraweek |
| 105.45 | 106.15 | 105.20 | 103.00 |
| 105.70 | 106.40 | 104.70 | 102.00 |
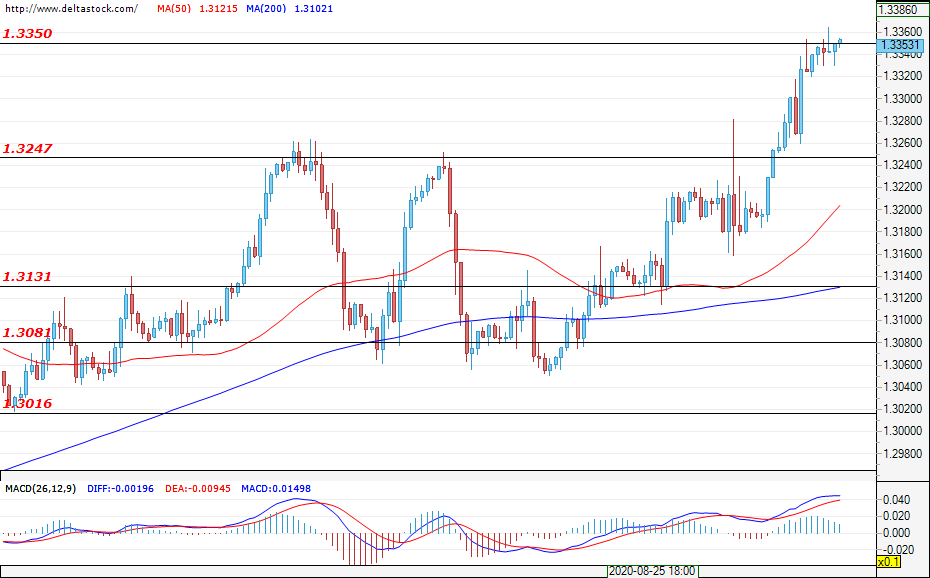
GBP/USD
Current level – 1.3353
The currency pair successfully broke through the key resistance at 1.3250, strengthening the bulls. They, in turn, sent the GBP/USD up to the levels of the next important resistance zone at 1.3350. At the time of writing the analysis, we are witnessing a consolidation just below the aforementioned 1.3350 level. The most important economic data for the Cable this week will be the PMI Services data (Thursday; 08:30 GMT) and the PMI Construction data (Friday; 11:30 EEST).
| Resistance | Support | ||
| intraday | intraweek | intraday | intraweek |
| 1.3350 | 1.3600 | 1.3250 | 1.3080 |
| 1.3510 | 1.3800 | 1.3130 | 1.3015 |