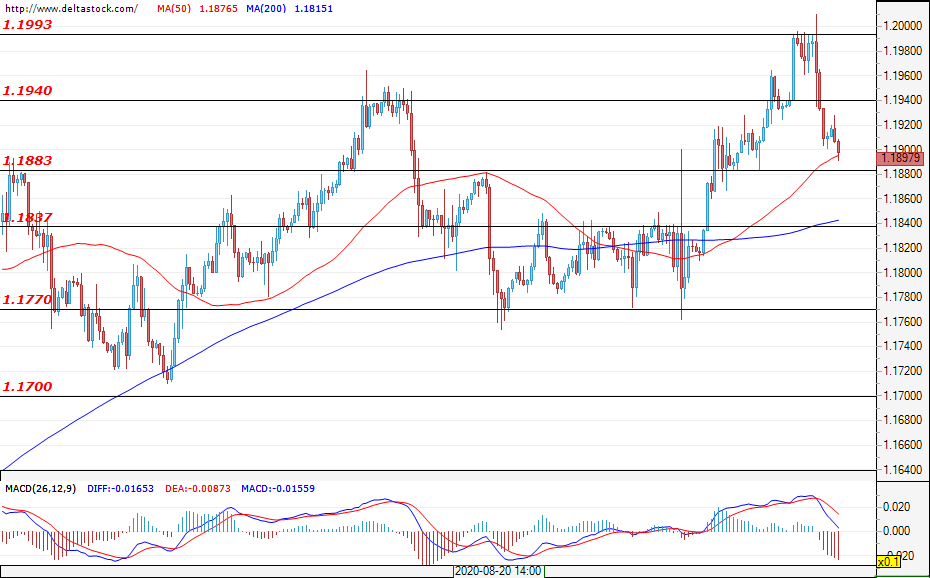
EUR/USD
Current level – 1.1897
The pair couldn’t hold onto its daily gains as the bears aggressively entered the market when prices peaked above 1.2000. Market sentiment is rather mixed and the pair will probably continue to trade in the range between 1.1700 and 1.2000. Positive news in relation to the U.S. economy, like the ADP non-farm payrolls (today at 12:15 GMT) and the NFP (Friday at 12:30 GMT), could support the dollar for a deeper pullback towards 1.1700. First intraday supports are 1.1883 and 1.1837. First resistance for the bulls is 1.1940. A second attempt at breaching 1.1200 is still on the table, however the market would need some time to digest the recent sell-off.
| Resistance | Support | ||
| intraday | intraweek | intraday | intraweek |
| 1.1940 | 1.2080 | 1.1883 | 1.1770 |
| 1.2000 | 1.2200 | 1.1837 | 1.1700 |
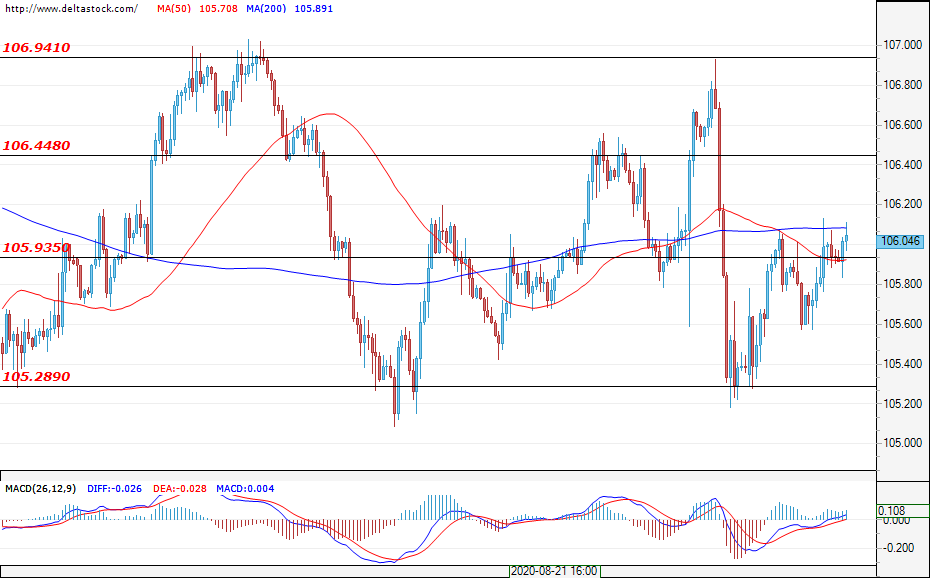
USD/JPY
Current level – 106.04
The market is trading in a range between 105.28 and 106.94, with the whole formation finding itself in seller-controlled territory that started from the 107.20 resistance level. Buyers could try to test the 106.44 resistance, however the general market conditions are not in their favor. Due to the speed and intensity of the recent sell-off, the market could form a small consolidation around the current levels and try to overtake the 105.28 support, with 104.70 being its primary target.
| Resistance | Support | ||
| intraday | intraweek | intraday | intraweek |
| 106.44 | 107.20 | 105.93 | 104.70 |
| 106.94 | 107.20 | 105.28 | 104.22 |
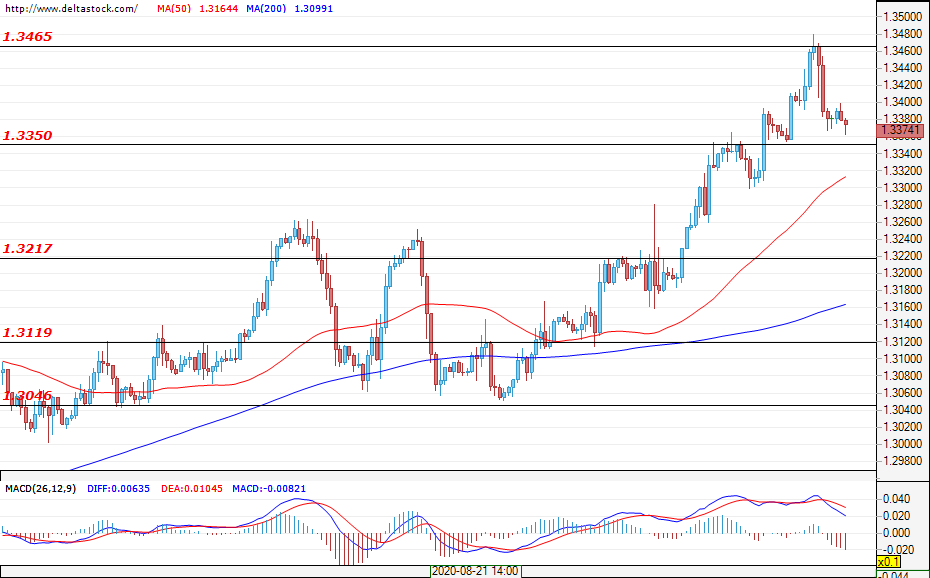
GBP/USD
Current level – 1.3374
Similar to the euro, the cable also couldn’t hold onto its daily gains after the rally encountered significant resistance at 1.3465. One probable scenario for the pair is for the market to enter a consolidation or a rentracement phase before the bulls make another attempt to breach the resistance. First support for the bulls sits at 1.3350 and the next one is found at 1.3217. If the rally regains its momentum, the new targets for the pair could be the levels coming from the largest time frames – 1.3800 and 1.4270.
| Resistance | Support | ||
| intraday | intraweek | intraday | intraweek |
| 1.3465 | 1.3600 | 1.3350 | 1.3120 |
| 1.3510 | 1.3800 | 1.3217 | 1.3050 |