Gold (XAU/USD) is confirming a contracting triangle chart pattern. This price pattern was expected in our analysis after price action strongly dropped within a large and established uptrend. Is the triangle now close to being completed?
Price Charts and Technical Analysis
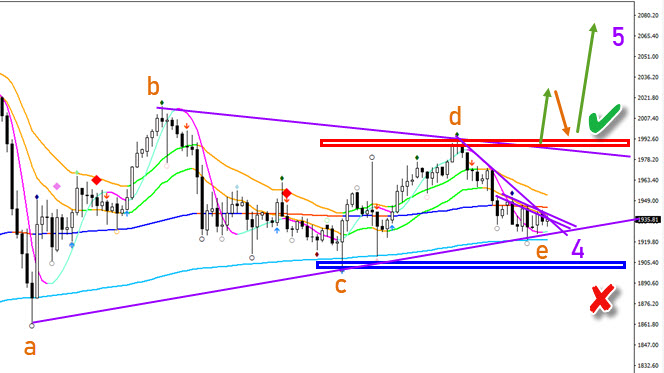
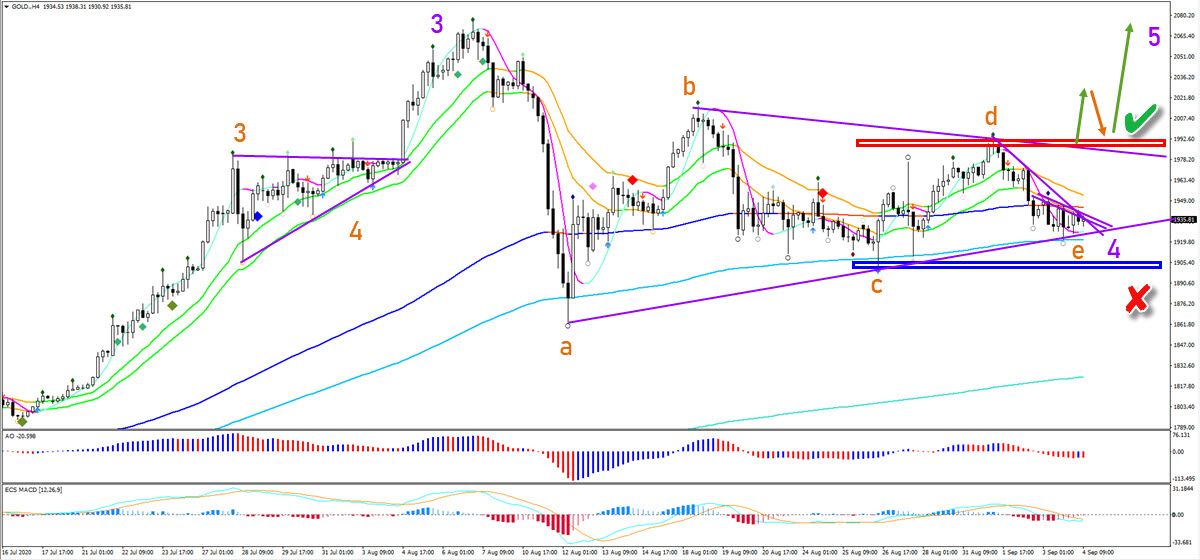
The XAU/USD is now testing the bottom of wave C (blue box). This is a critical and interesting point of any potential triangle pattern. The reason is simple: price is close to either confirming (green check) or invalidating (red x) this wave pattern. The retest of the previous bottoms could be a final wave E (orange) and indicate the end of the triangle pattern. This would also complete wave 4 (purple).
The breakout above the resistance trend line and the top of wave D (red box) would confirm the end of the triangle pattern and the continuation of the uptrend. The breakout is likely part of a wave 5. This wave 5 could be part of a wave 3 on higher time frames – especially when considering the strong uptrend. It is key that price action stays above the wave C bottom. A break above the 21 ema zone could already be a first clue that an upside break is around the corner.