
The EUR/USD currency pair
Technical indicators of the currency pair:
Prev Open: 1.18483
Open: 1.18453
% chg. over the last day: -0.02
Day’s range: 1.18246 – 1.18462
52 wk range: 1.0637 – 1.2012
The EUR/USD currency pair continues to consolidate. The technical pattern is ambiguous. Financial market participants assess the US labor market report for August, which turned out to be quite optimistic. In the country’s nonfarm sector, 1.371K new jobs were created, which is slightly below market expectations at 1.400K. At the same time, the growth of average hourly earnings accelerated from 0.1% (MoM) to 0.4% (MoM). The unemployment rate fell to 8.4% from 10.2%. Investors expect the ECB meeting later this week. At the moment, EUR/USD quotes are consolidating in the range of 1.1820-1.1860. Positions should be opened from these marks.
Today, the news feed is calm. US financial markets are closed due to the holiday.
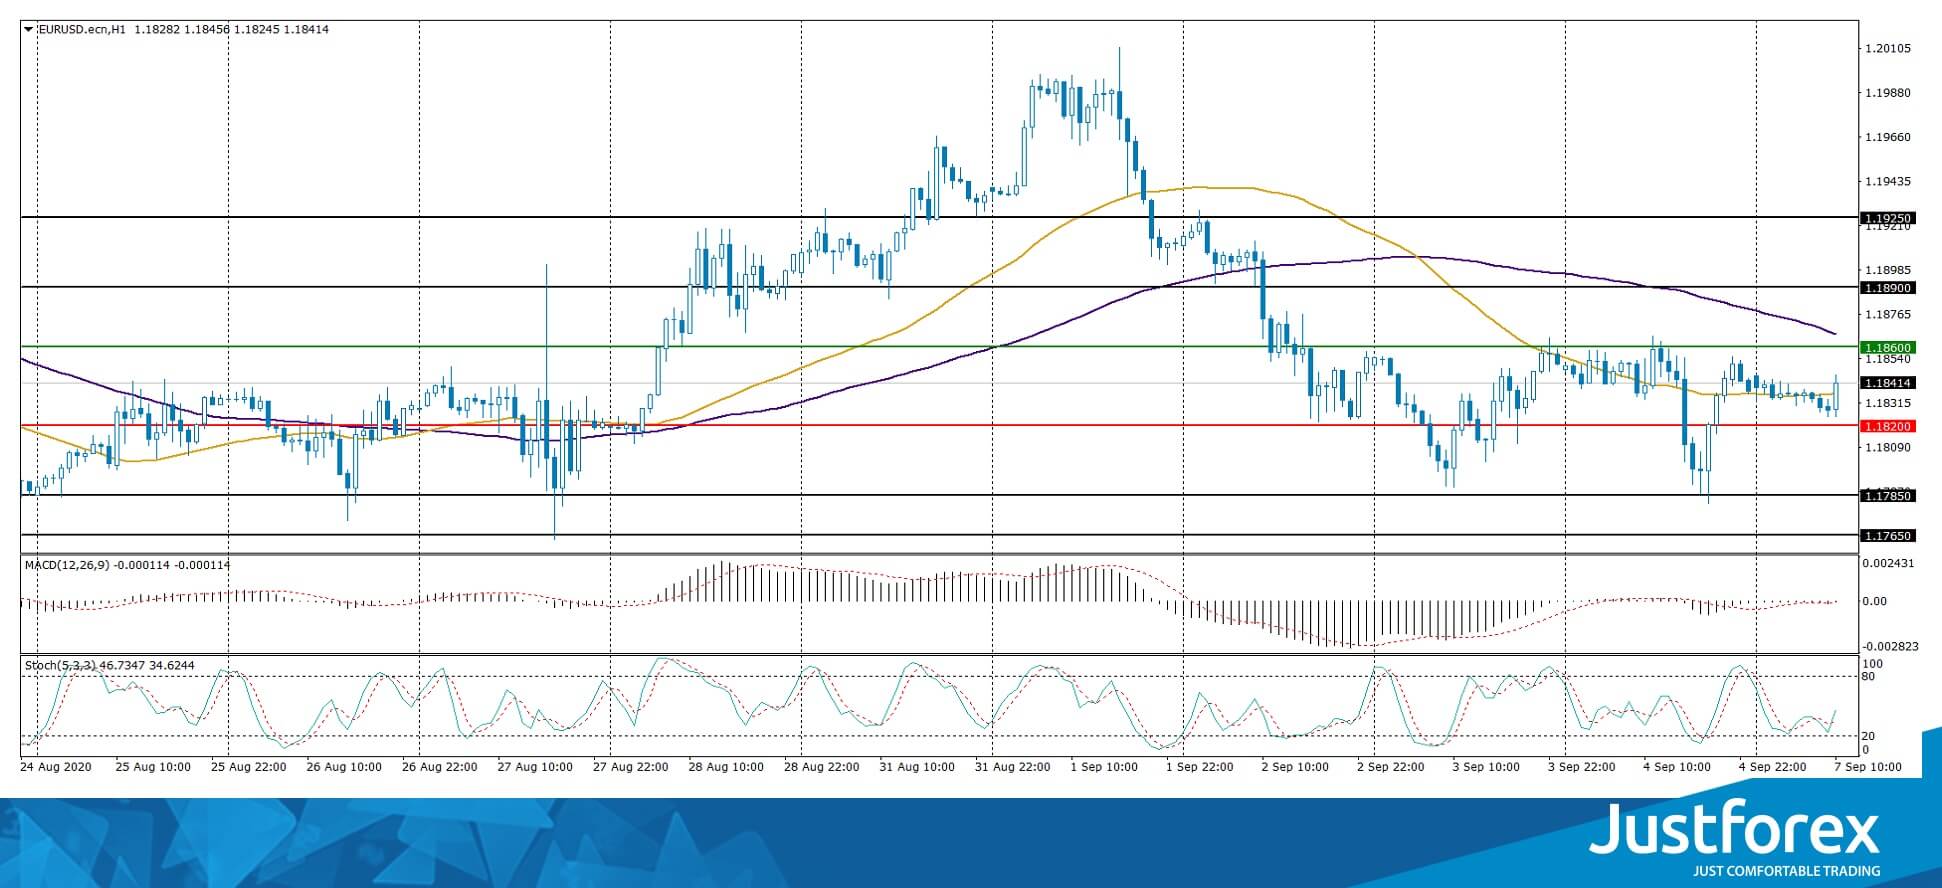
Indicators do not give accurate signals: the price has crossed the 50 MA.
The MACD histogram is near the 0 mark.
Stochastic Oscillator is in the neutral zone, the %K line has crossed the %D line. There are no signals at the moment.
Trading recommendations
Support levels: 1.1820, 1.1785, 1.1765
Resistance levels: 1.1860, 1.1890, 1.1925
If the price fixes below 1.1820, further correction of EUR/USD quotes is expected. The movement is tending to 1.1780-1.1750.
An alternative could be the growth of the EUR/USD currency pair to 1.1900-1.1930.
The GBP/USD currency pair
Technical indicators of the currency pair:
Prev Open: 1.32640
Open: 1.32438
% chg. over the last day: -0.27
Day’s range: 1.31978 – 1.32638
52 wk range: 1.1409 – 1.3516
The bearish sentiment prevails on the GBP/USD currency pair. The British pound has set new local lows. At the moment, the trading instrument is consolidating in the range of 1.3200-1.3260. The technical pattern signals a further decline in GBP/USD quotes. Brexit talks between UK and EU officials should resume in London on Tuesday. We recommend following up-to-date information on this issue. Positions should be opened from key levels.
The publication of important UK economic reports is not planned.
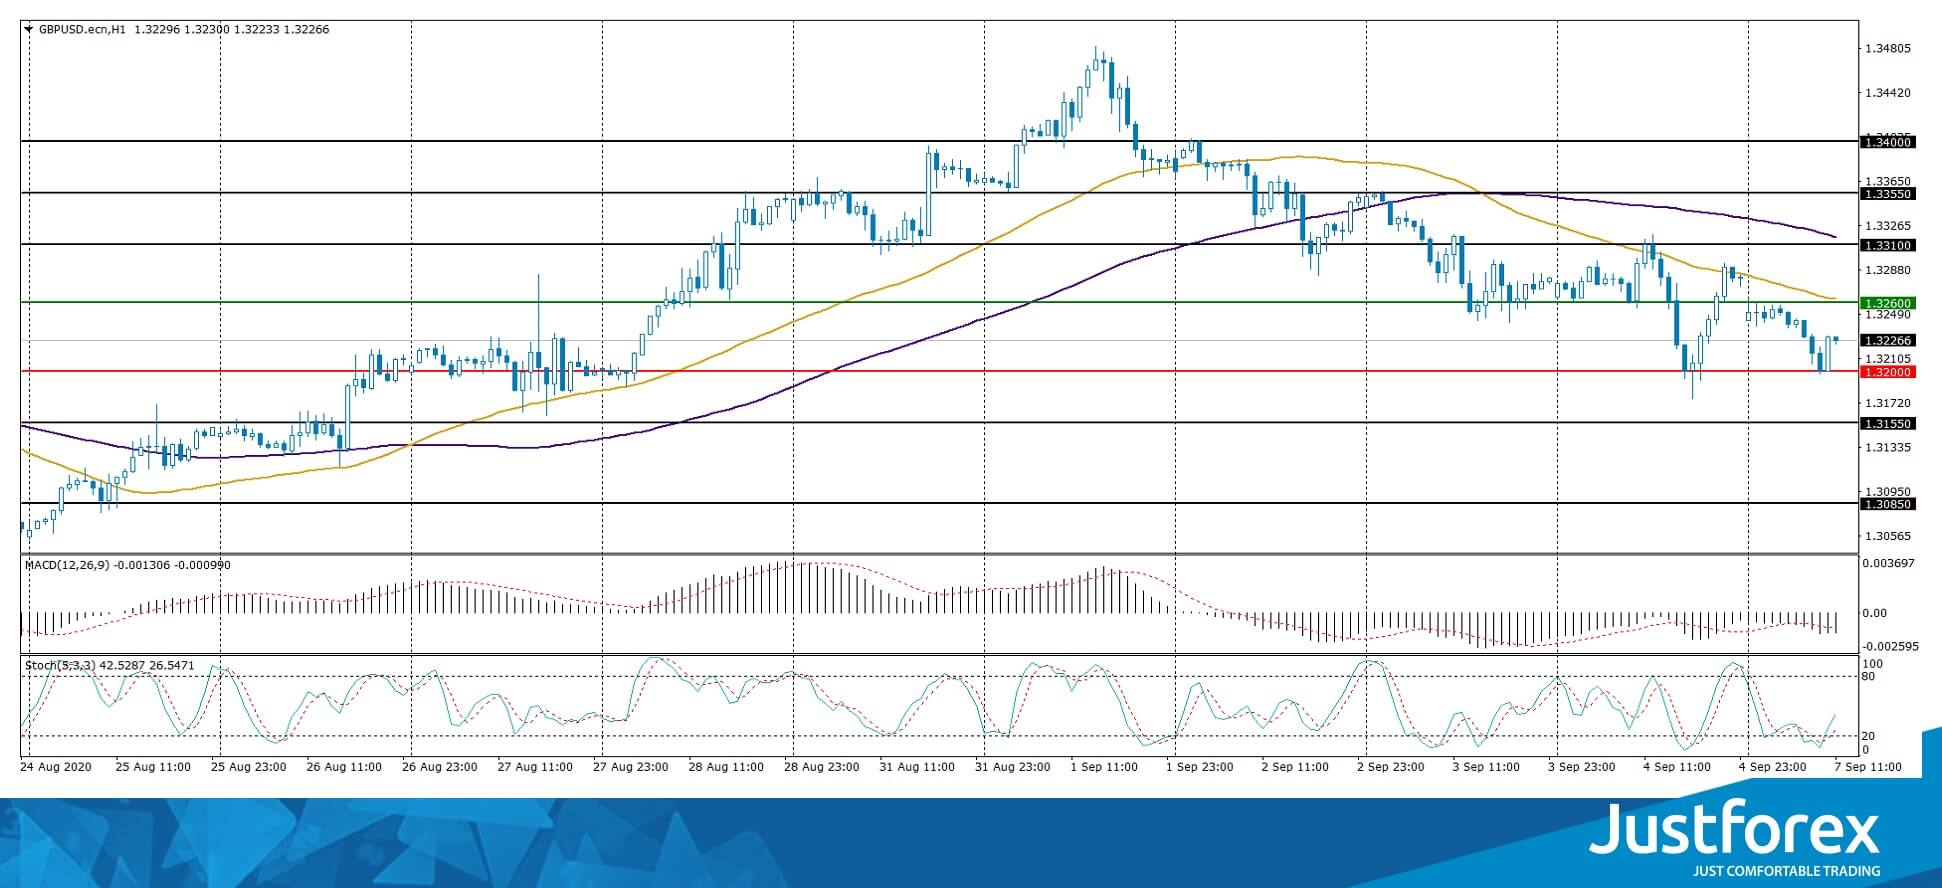
Indicators signal the power of sellers: the price has fixed below 50 MA and 100 MA.
The MACD histogram is in the negative zone, which gives a signal to sell GBP/USD.
Stochastic Oscillator has started exiting the oversold zone, the %K line is above the %D line, which indicates the bullish sentiment.
Trading recommendations
Support levels: 1.3200, 1.3155, 1.3085
Resistance levels: 1.3260, 1.3310, 1.3355
If the price fixes below 1.3200, further correction of GBP/USD quotes is expected. The movement is tending to 1.3150-1.3120.
An alternative could be the growth of the GBP/USD currency pair to 1.3310-1.3350.
The USD/CAD currency pair
Technical indicators of the currency pair:
Prev Open: 1.31226
Open: 1.30464
% chg. over the last day: -0.50
Day’s range: 1.30450 – 1.31120
52 wk range: 1.2949 – 1.4669
There is an ambiguous technical pattern on the USD/CAD currency pair. The trading instrument is consolidating. At the moment, the local support and resistance levels are 1.3080 and 1.3120, respectively. Investors assess reports on the US and Canada’s labor markets. We recommend paying attention to the dynamics of “black gold” prices. Positions should be opened from key levels.
Today, the news feed on Canada’s economy is calm
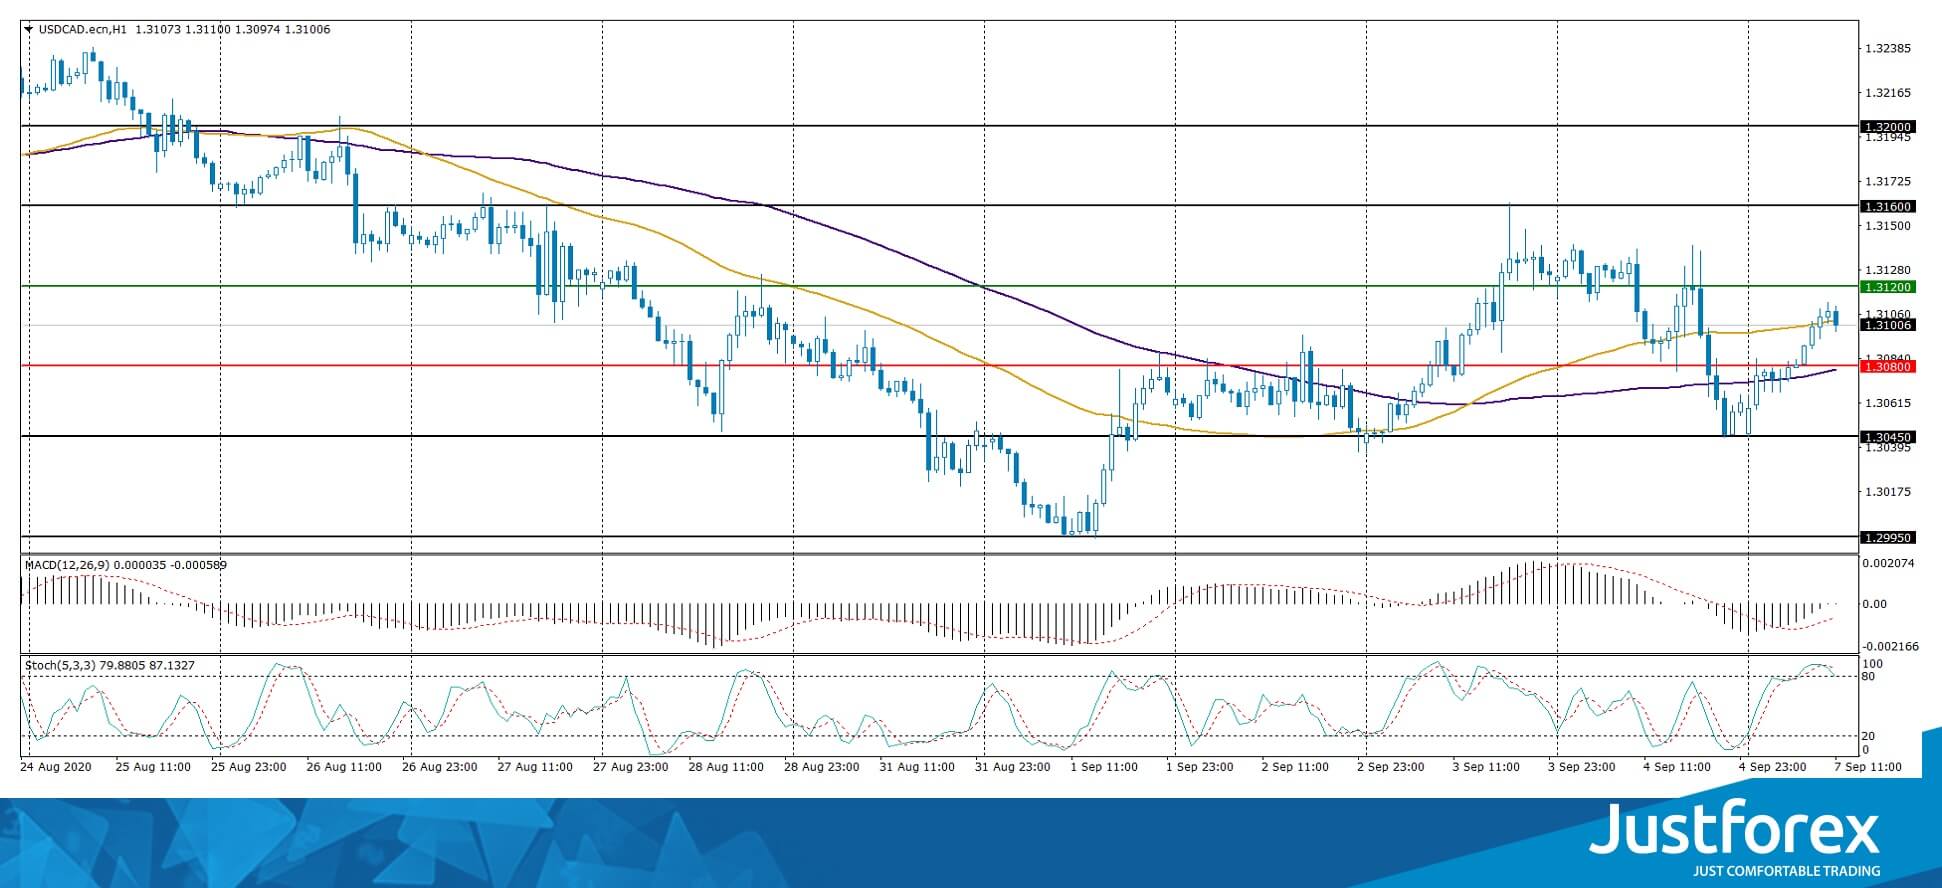
Indicators do not give accurate signals: the price has crossed the 50 MA and 100 MA.
The MACD histogram is near the 0 mark. There are no signals at the moment.
Stochastic Oscillator is in the overbought zone, the %K line has crossed the %D line. There are no signals at the moment.
Trading recommendations
Support levels: 1.3080, 1.3045, 1.2995
Resistance levels: 1.3120, 1.3160, 1.3200
If the price fixes above 1.3120, USD/CAD quotes are expected to grow. The movement is tending to 1.3160-1.3180.
An alternative could be a decline in the USD/CAD currency pair to 1.3045-1.3020.
The USD/JPY currency pair
Technical indicators of the currency pair:
Prev Open: 106.161
Open: 106.217
% chg. over the last day: +0.02
Day’s range: 106.132 – 106.384
52 wk range: 101.19 – 112.41
The USD/JPY currency pair continues to consolidate. The technical pattern is ambiguous. At the moment, the local support and resistance levels are 106.00 and 106.35, respectively. Investors expect additional drivers. We recommend paying attention to the dynamics of US government bonds yield. Positions should be opened from key levels.
The news feed on Japan’s economy is calm.
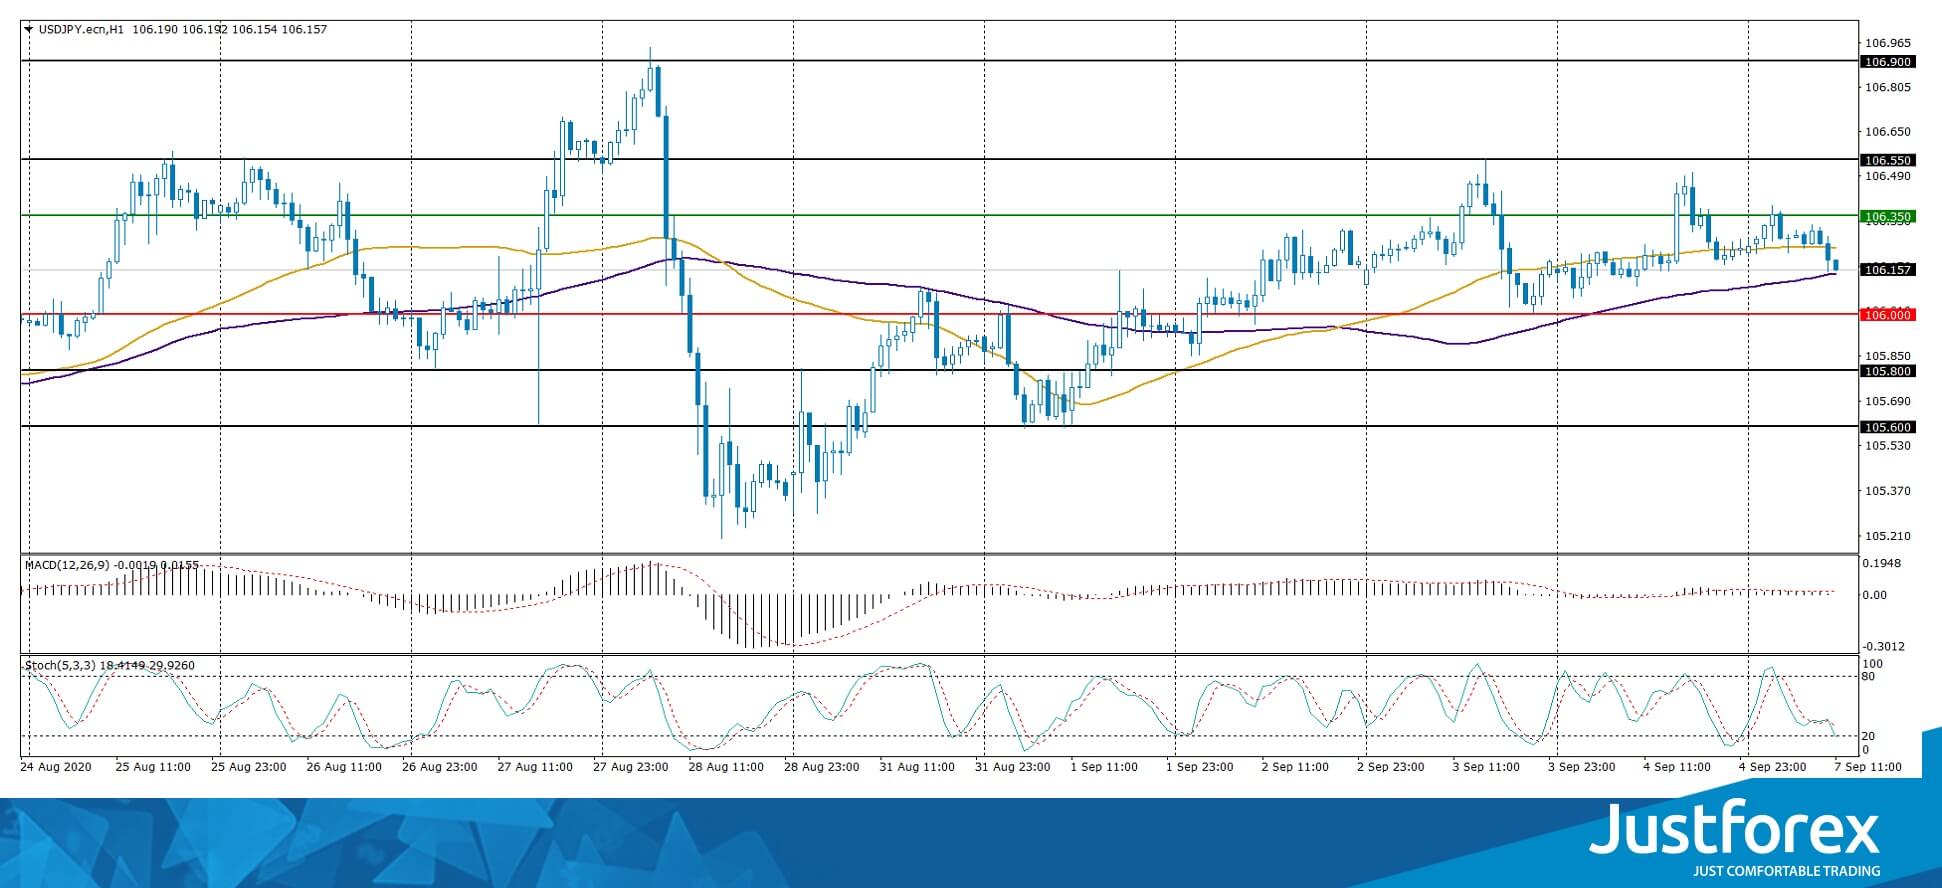
Indicators do not give accurate signals: the price has crossed the 50 MA and 100 MA.
The MACD histogram is near the 0 mark.
Stochastic Oscillator is in the neutral zone, the %K line is below the %D line, which indicates the bearish sentiment.
Trading recommendations
Support levels: 106.00, 105.80, 105.60
Resistance levels: 106.35, 106.55, 106.90
If the price fixes above 106.35, USD/JPY quotes are expected to grow. The movement is tending to 106.65-106.90.
An alternative could be a decline in the USD/JPY currency pair to 105.70-105.50.


