
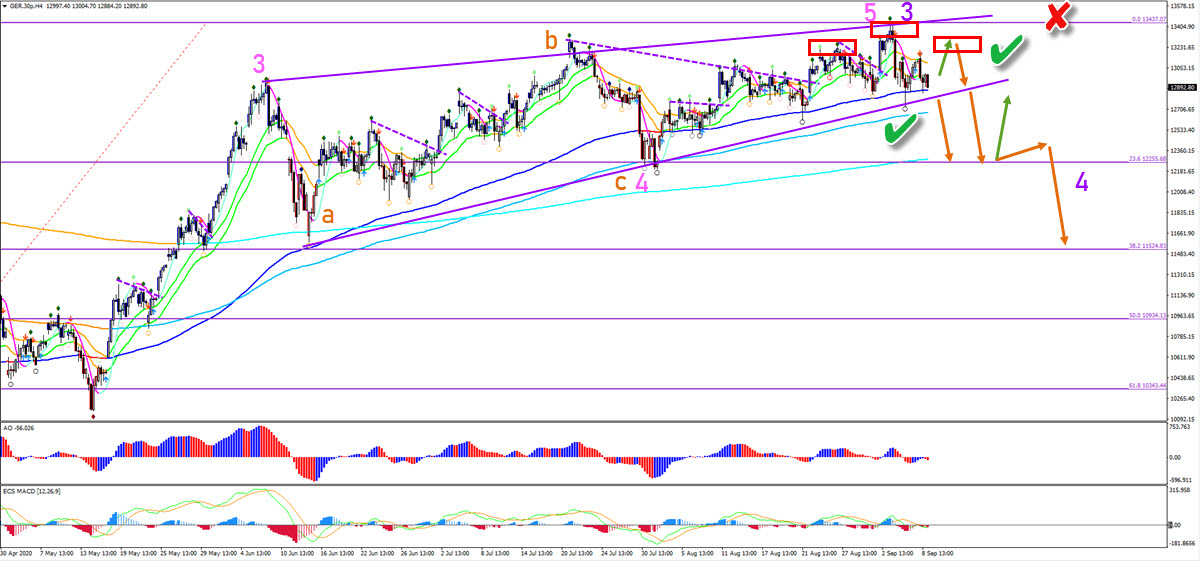
The German index DAX 30 is building a rising wedge reversal chart pattern (purple lines). The uptrend is losing steam and larger retracement is around the corner. What could confirm this bearish pullback?
Price Charts and Technical Analysis
The DAX 30 seems to have completed a 5 wave (pink) of a potential wave 3 (purple). The bulls, however, are struggling to push higher. The recent break below the 21 ema zone is a first warning signal. A candle close below the 144 ema could confirm an immediate bearish breakout towards the 23.6% Fibonacci retracement level. But keep in mind that a bullish candle could still send the DAX higher to test the head and shoulders pattern (red boxes) first. A break of the top invalidates the retracement outlook (red x).
The DAX was using the 21 ema zone as a support area until recently. Now price has broken below the zone and also used it once as a resistance. A candle close in the red box could confirm a reversal breakout and potential continuation within the wave C (pink). Main target is the 23.6% Fib at the moment because the pullback could be part of a larger wave 4 (purple).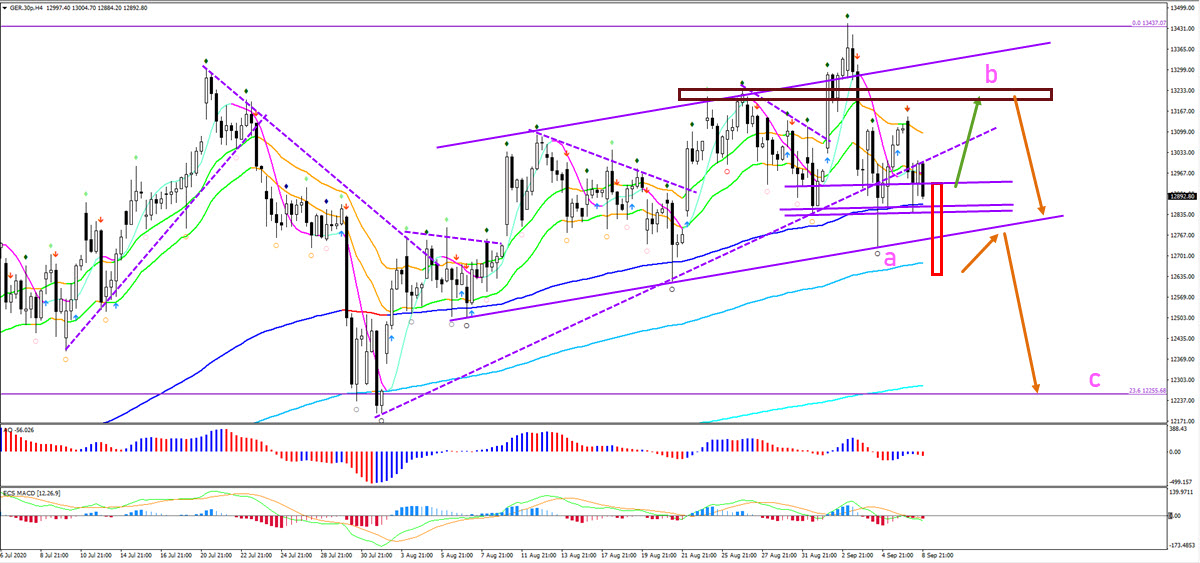


