The GBP/USD is in free fall. The Cable declined more than 600 pips in a few trading days. Can the GU continue its bearish momentum or will a bullish correction take place?
Price Charts and Technical Analysis
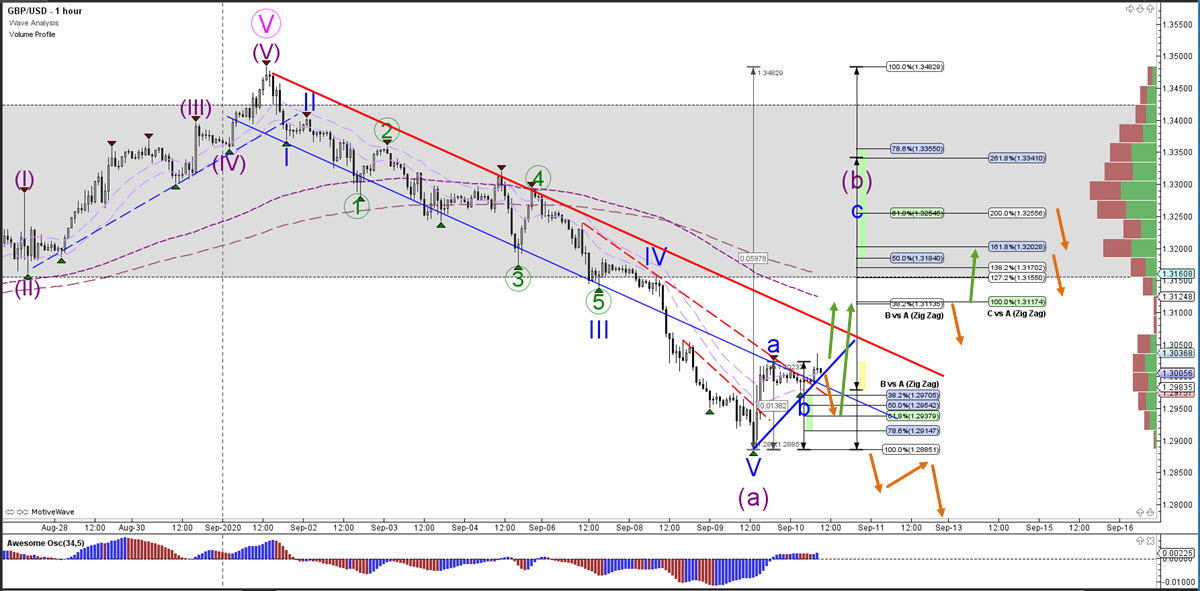
The GBP/USD has a higher probability of building a bullish retracement at the moment. A bullish ABC (blue) pattern could take place after the strong bearish decline. The Fibonacci retracement levels of wave B vs A could act as support for a push up. Although an immediate bullish breakout would be logical too. The first main target is the 38.2% Fib and 100% Fib target. Our volume profile, however, indicates that stronger resistance might be expected at higher price levels, like the 50-61.8% Fib zone. Only a break below the bottom of wave B (blue) would indicate an immediate downtrend continuation.
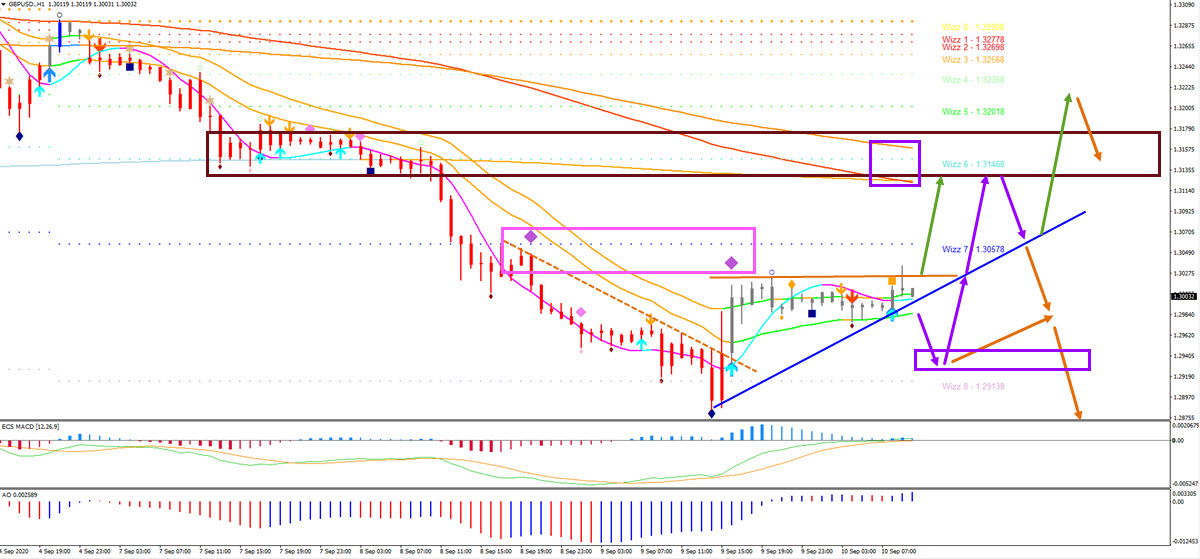
Our Elliott Wave software is indicating a retracement mode (grey candles) after a strong push down (red candles). The arrows indicate key bounce and break out spots. The purple arrows indicate the expected path of least resistance at the moment. Due to the strong bearish momentum on higher time frames (purple diamonds in pink box), the key aspects for a downtrend continuation are the 144 ema zone (dark red box) and the break of a future fractal (purple box).