This week we witnessed a sharp decline in Nikkei followed by an equally sharp rally. Our weekend update informed members that a decline was expected to unfold this week followed by a reaction higher, we even showed them the area where we expected the decline to end and reaction higher to take place. In this article, we will look at the weekend chart of Nikkei and how the market reacted after reaching the target area.
Nikkei 4 Hour Elliott Wave Analysis 9.19.2020 [Weekend Update]
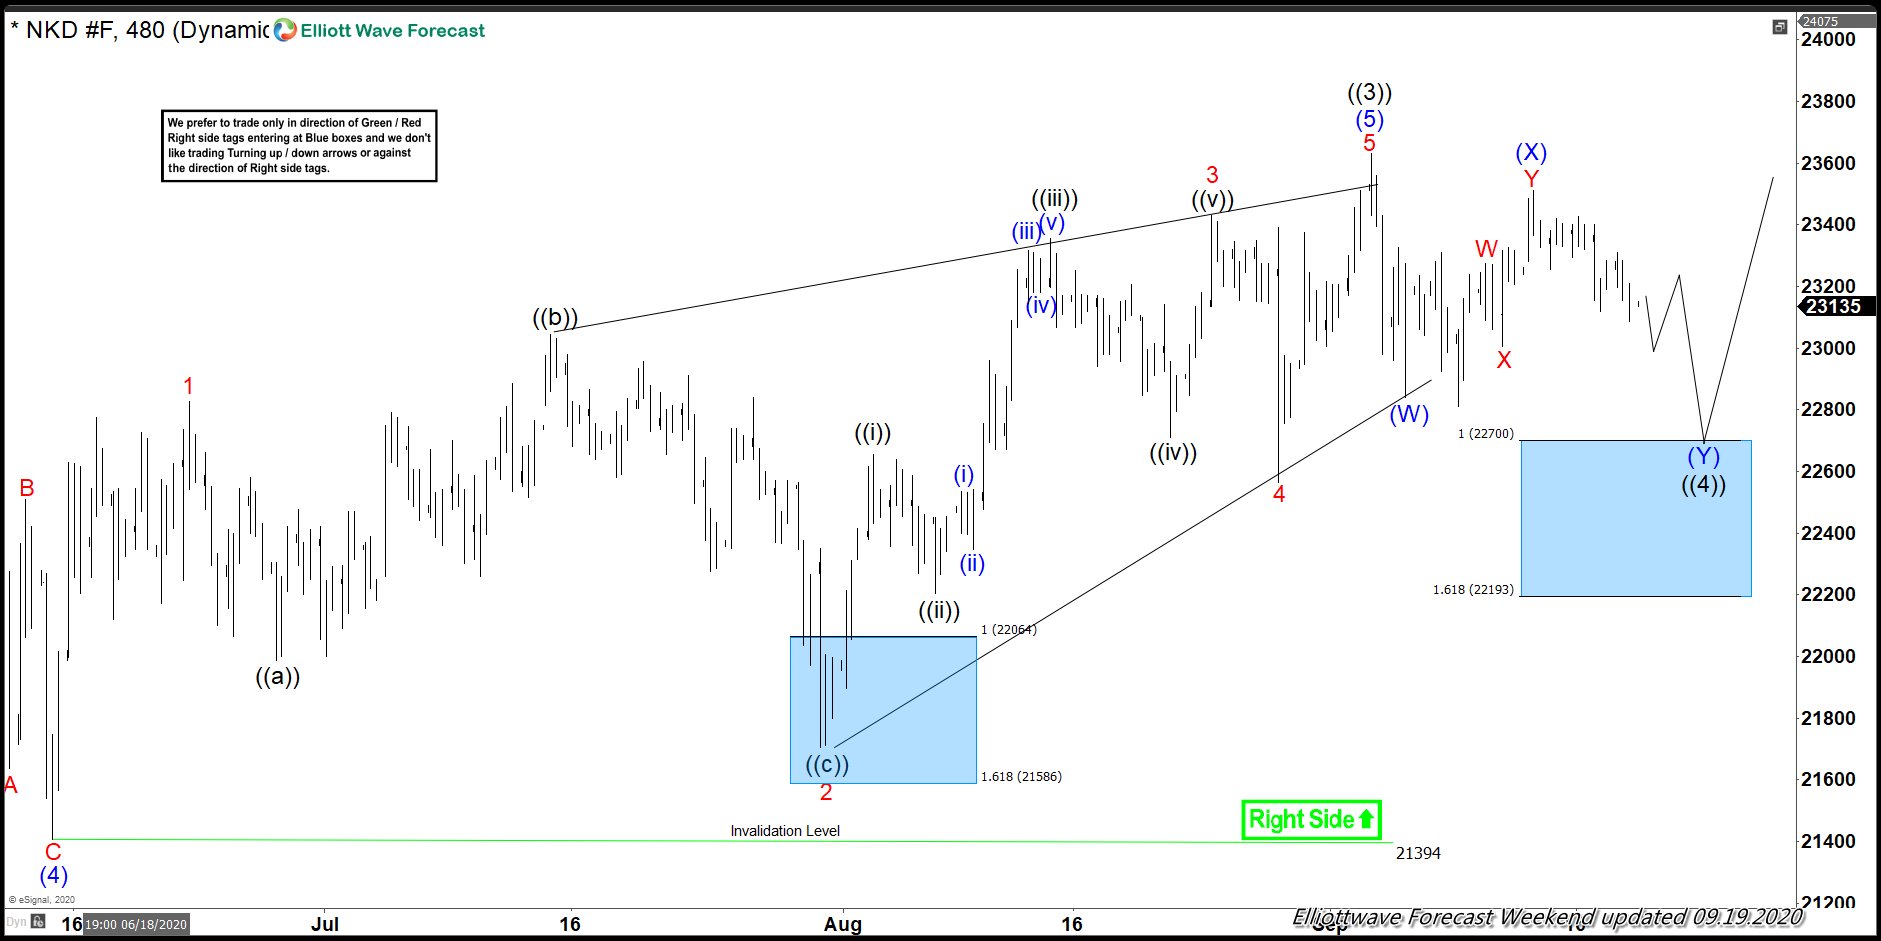
Chart below shows Nikkei completed wave ((3)) at 23630 on September 2, 2020 and started the pull back in wave ((4)). It dropped in 3 waves to 22840 on September 4, 2020 which we labelled as wave (W) followed by a double there correction higher to 23510 on September 14, 2020 which we labelled as wave (X). Based on the fact that it made a new low below 22840 as part of wave (X) correction and based in market correlation with other World Indices, we expected it to continue lower in a double three Elliott wave correction toward 22700 – 22193 which is 100 – 1.618 Fib extension area of wave (W) related to wave (X). We highlighted this area with a blue box because blue boxes are high-frequency areas which are based in a relationship of sequences, cycles and calculated using extensions. In these blue boxes, both buyers and sellers again in direction of next move for 3 swings at least and hence why we also call them no enemy areas. Chart below shows Index already started trading lower in proposed wave (Y) and was expected to extend the decline this week before turning higher again from the blue box area to resume the rally or produce a bounce in 3 waves at least.
Nikkei 4 Hour Elliott Wave Analysis 9.23.2020 [Latest Update]
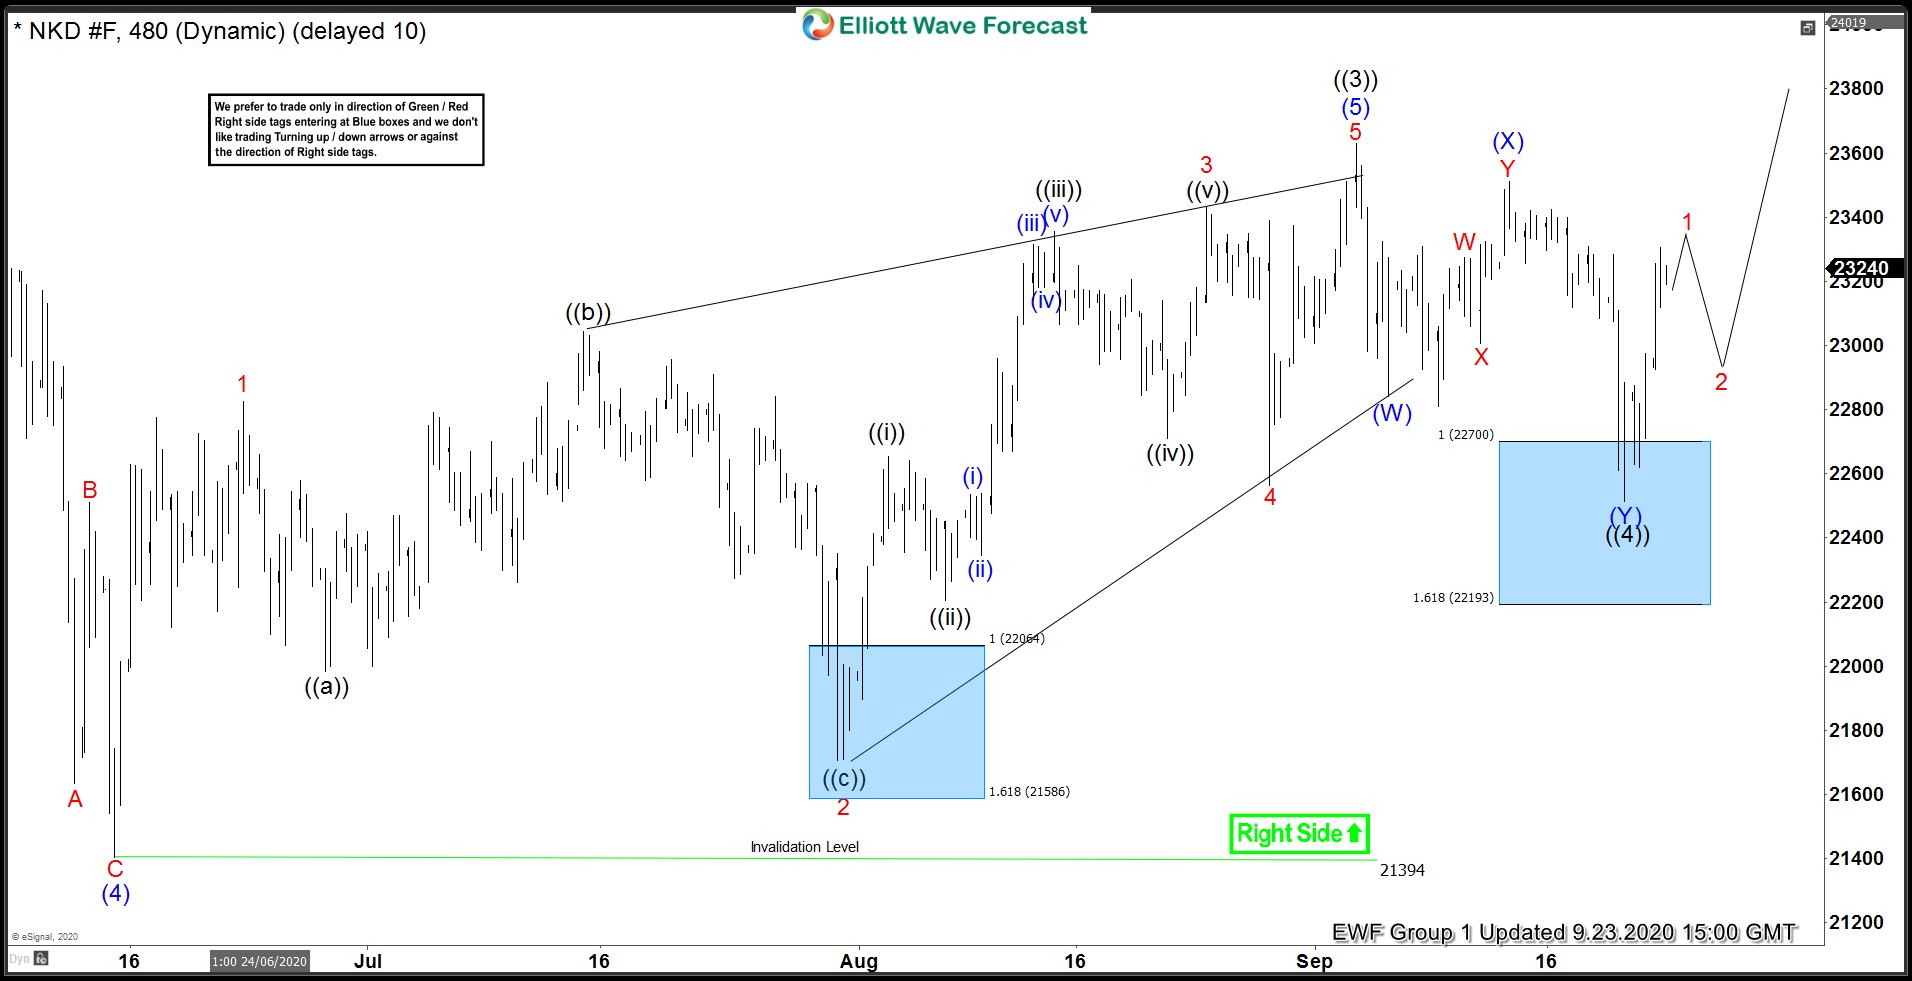
This is the latest chart from today (September 23,2020). It showed Index did extend the decline and reached the blue box area, it found a low at 22515 and started rallying. Rally appears to be unfolding as an impulse but another short-term high is still required to complete the impulse. While below the peak at 23630, larger double three correction lower still can’t be ruled out in which the low at 22515 becomes wave (W) and current bounce becomes wave (X). However, knowing the blue box area was a bouncing area helped our members to plan their trades accordingly and any buyers which entered in the blue box should now already be risk free.