Microsoft stock (MFST) is building a bearish retracement, similar to the enter stock market. Our Elliott Wave software is indicating red daily candles and a strong pullback BUT the entire trend is heavily up (huge spaces between long-term moving averages). What’s next for this chart?
Price Charts and Technical Analysis
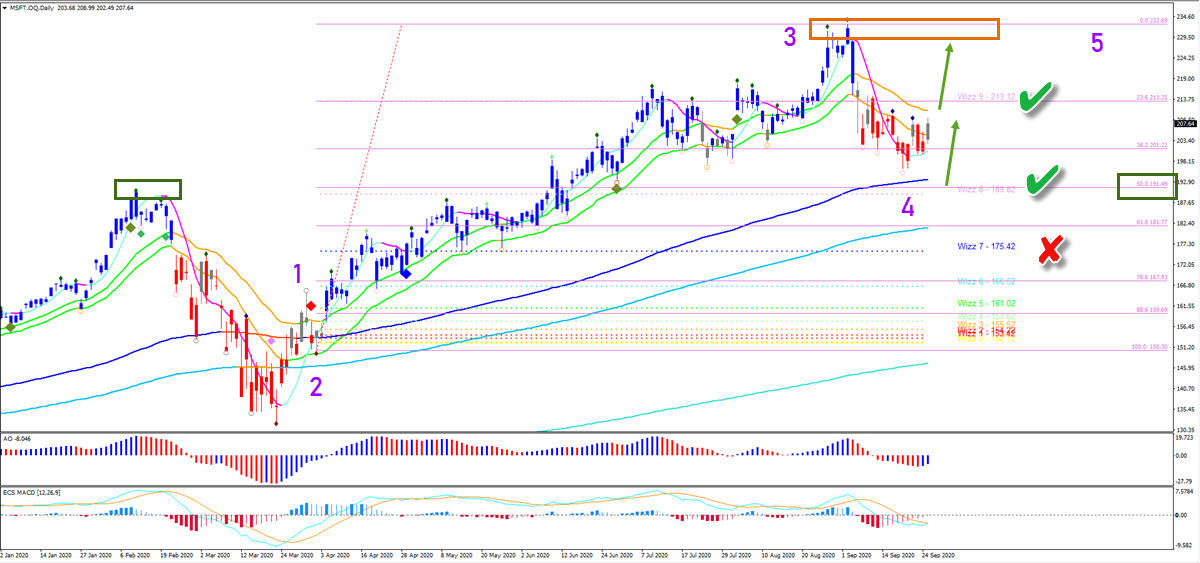
Microsoft is testing the shallow Fibonacci retracement levels of potential wave 4 (purple). This is expected to act as a potential support and bouncing spot. Price could either break above the 21 ema to confirm the bullish continuation. Or price action could retest the deeper 50% Fib, the 144 ema, and previous top (green boxes). The first target for the bulls is the previous top. A break below the 61.8% Fib makes the wave 4 pattern less likely (red x).
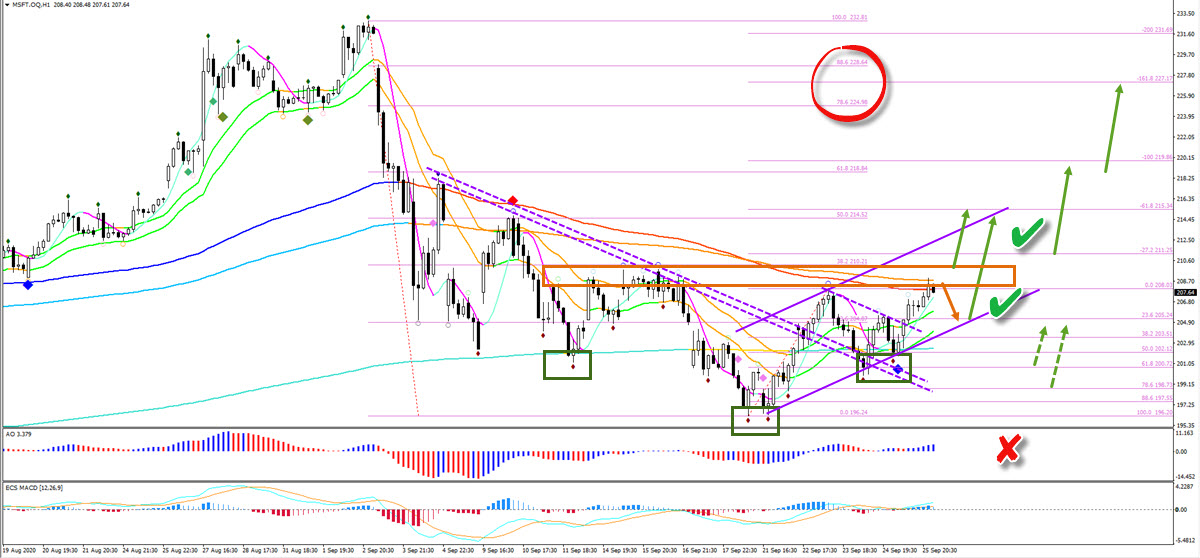
The 1 hour chart (see below) broke above the resistance trend lines (dotted purple) after building an inverted head and shoulders pattern (green boxes). But price action must break above the key resistance too (orange box) otherwise the pair remains in uncertain territory. A break below the bottom makes the upside less likely (red x). A bullish breakout (green arrows) should see price move up towards the Fibonacci targets (red circle).