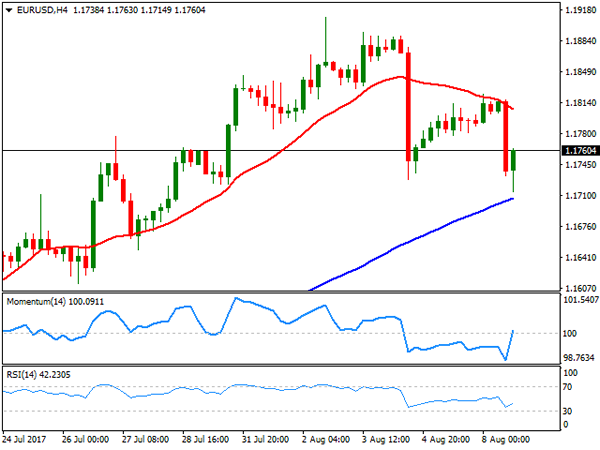
EUR/USD
After a dull start to the day, the greenback gather upward momentum against all of its major rivals after Wall Street’s opening, with EUR/USD’s decline extending down to 1.1714 before bouncing to settle around 1.1760. The US released some minor macroeconomic figures, all of them encouraging. The NFIB Index of Small Business Optimism rose 1.6 points to 105.2 in July, above June’s 103.6, whilst the IBD/TIPP Economic Optimism for August climbed to 52.2 above previous 50.2, also above the 12-month average of 51. Additionally, the number of jobs´ openings increased to 6.163 million in June, beating expectations and at an all time high. Dollar’s gains were exacerbated by thin trading conditions, with the currency ending the day mixed across the board.
The EUR/USD pair has bounced from a critical static support the 2015 yearly high which was set at 1.1713, and the 4 hours chart shows that it stands now well below a bearish 20 SMA, after the indicator contained advanced all through the day. Technical indicators in the mentioned time frame have bounced with different strength with the Momentum heading higher around its mid-line, but the RSI indicator holding near oversold levels, indicating that the risk remains towards the downside, particularly if the mentioned support gives up. A break below the mentioned level will open doors for a steeper correction, although seems unable that the dollar could advance much more ahead of Friday’s inflation release in the US.
Support levels: 1.1715 1.1680 1.1630
Resistance levels: 1.1785 1.1820 1.1860
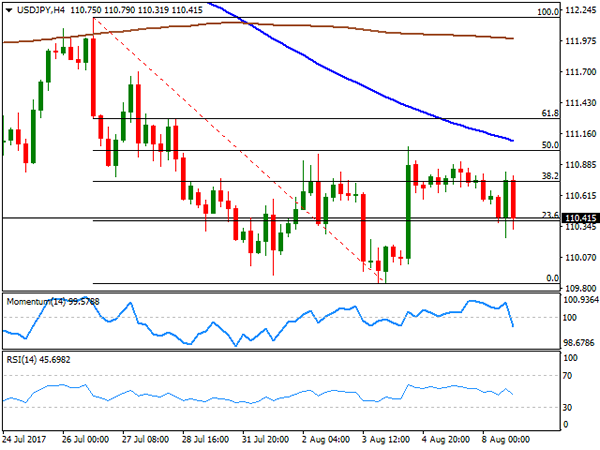
USD/JPY
The USD/JPY pair ended the day in the red around 110.40, having quickly reverted an advance up to 110.82, this last triggered by strong US employment data, as the number of open jobs reached a record high of 6.16 million at the end of June, up 461,000 from May and exceeding the expected 5.6 million. Anyway, the pair resumed its decline afterwards, retaining the bearish bias seen over the last few weeks. The pair keeps trading within Fibonacci levels, trapped most of this Tuesday between the 23.6% and the 38.2% retracement of the latest daily decline between 112.18 and 109.84, with scope to test this last on a break below the daily low of 110.24. Technical readings in the 4 hours chart support such decline as the 100 SMA extended its slide above the current level, now around 111.10, while the Momentum indicator entered bearish territory with a strong bearish slope and the RSI indicator resumed its slide after failing to surpass its mid-line, currently at 46.
Support levels: 110.25 109.85 109.50
Resistance levels: 110.70 111.05 111.40
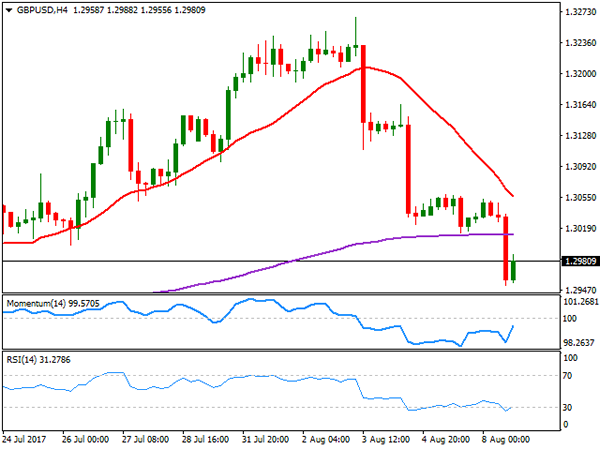
GBP/USD
The GBP/USD pair plunged to 1.2952, as a bout of dollar’s buying affected the most a weakened Pound, further extending after the pair broke the critical 1.3000 support. There were no macroeconomic releases in the UK, but the Sterling became vulnerable by the end of last week, when the BOE decided to remain on-hold, and somehow suggested that a rate hike for this year is out of the table. Adding to the bearish case of the British currency is the uncertainty surrounding Brexit, with negotiations being slow and painful, and with no signs of progress. From a technical point of view, the pair has scope to fall further as long as it holds now below the mentioned psychological level, and as long as news coming from the US don’t result disappointing. In the 4 hours chart, the price settled below its 200 EMA for the first time in almost a month, while the 20 SMA accelerated its decline above the current level, now reinforcing the static resistance area around 1.3060. Technical indicators in the mentioned chart have managed to bounce from oversold readings, rather reflecting the late recovery than suggesting downward exhaustion, still holding within negative territory, limiting therefore chances of a recovery.
Support levels: 1.2965 1.2920 1.2880
Resistance levels: 1.3005 1.3030 1.3060
GOLD
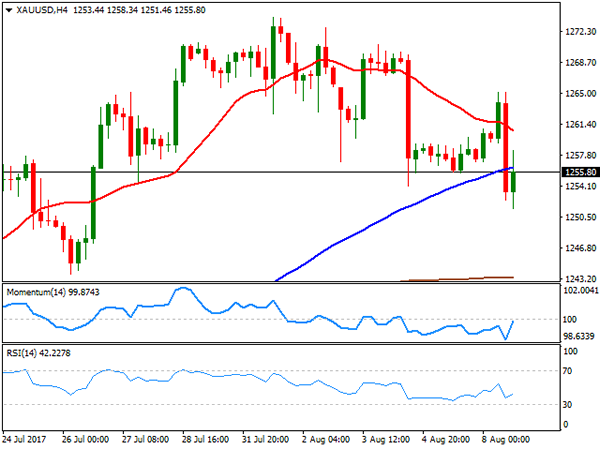
Spot gold settled at $1,255.79 a troy ounce, the lowest in two weeks, as the market decided to give the greenback a vote of confidence after another solid local employment report, as the number of jobs’ opening hit a record high in June. The figure came after a solid US employment report for July, and should keep the Fed in the tightening path, although no rate move is expected for September. The daily chart for gold indicates and increasing bearish potential, although further confirmations are required, as technical indicators are now hovering around their mid-lines, with diminished downward strength, whilst the price settled around its 20 DMA after briefly falling below the 100 DMA. In the 4 hours chart, the price settled below both, the 20 and 100 SMAs, with the shortest gaining bearish traction, in line with further declines, whilst technical indicators have managed to bounce within negative territory, still unable to re-enter bullish ground.
Support levels: 1,251.46 1,243.75 1,235.22
Resistance levels: 1,260.10 1,267.60 1,274.05
WTI CRUDE OIL
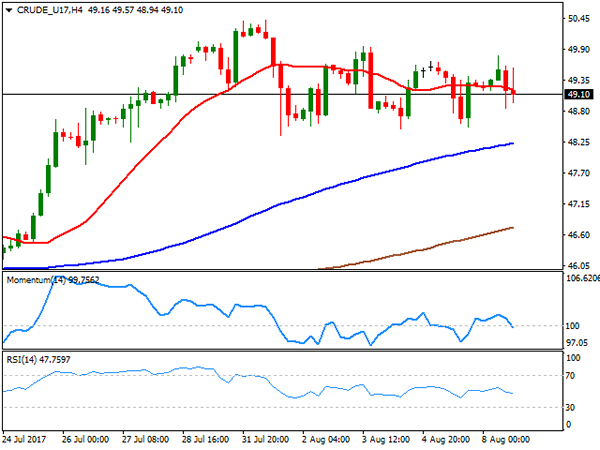
West Texas Intermediate crude futures settled at $49.10 a barrel, down for a second consecutive day, reverting early gains on news indicating that some OPEC producers increased their output in July, with crude oil exports from the OPEC reaching a record high in July mostly due to Nigeria and Libya exports, both exempt from the agreement to limit production. Further weighing on the commodity were news showing that Libya’s biggest oil field, Sharara, came back online after a short interruption on Monday. Ahead of the release of US stockpiles data, the commodity remains within a consolidative phase below the key 50.00 level, with the daily chart showing that technical indicators are retreating within positive territory, as the price remains trapped between its 100 and 200 SMAs. In the shorter term, and according to the 4 hours chart, the technical stance is neutral-to-bearish with the price a few pips below a directionless 20 SMA and technical indicators heading modestly lower within neutral territory.
Support levels: 48.50 47.90 47.20
Resistance levels: 49.65 50.20 50.85
DJIA
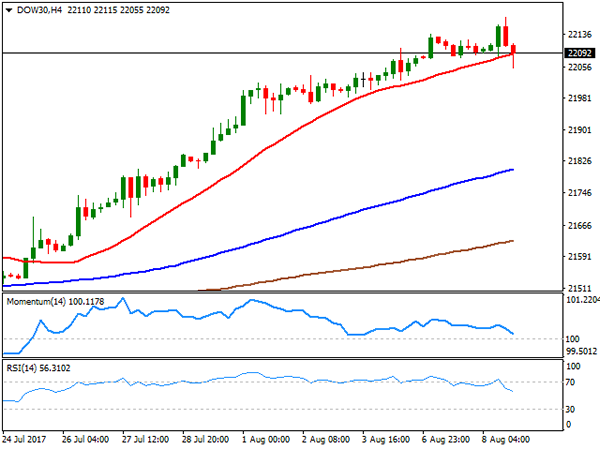
Having struggled around their opening levels for most of the day, US indexes finally turned south and closed in the red, amid a stronger dollar, and with healthcare and material stocks leading the way lower. The Dow Jones Industrial Average turned red after nine record closes, settling at 22,85.34, down by 33 points, while the Nasdaq Composite shed 13 points to 6,370.46. The S&P closed 6 points lower, at 2,474.92. Within the Dow, Apple was the best performer, adding 0.86%, followed by Chevron that added 0.61%. Leading decliners was El du Pont, down 0.84%, followed by Merck that shed 0.82.%. From a technical point of view, the daily chart shows that the index remains far above all of its moving averages that remain bullish, while technical indicators began correcting lower, still within overbought territory. In the 4 hours chart, the index settled a few points below its 20 SMA, whilst technical indicators have extended their declines within positive territory, now about to enter negative territory, supporting a bearish extension for this Wednesday that anyway will be seen as corrective after the latest record rally.
Support levels: 22,055 22,001 21,967
Resistance levels: 22,055 22,080 22,137
FTSE100
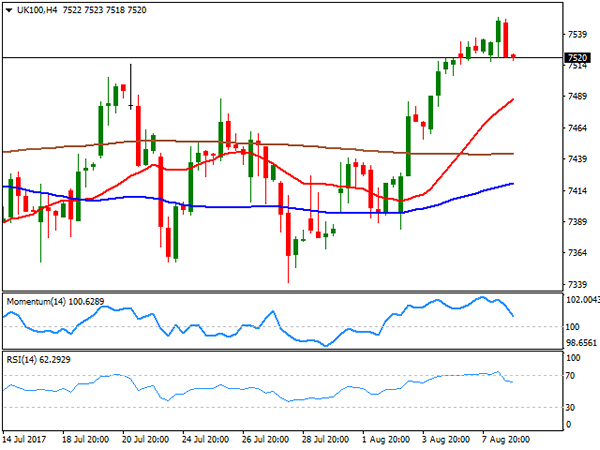
The FTSE 100 continued advancing this Tuesday, up 10 points to end at 7,542.73, not far below its previous record close of 7,547. A weaker Pound kept mood high among local investors, even despite earnings reports were not that encouraging. Paddy Power Betfair led decliners for a second consecutive day, down 4.11% after the bookmaker said it had suffered from "adverse sports results" in recent months, followed by InterContinental Hotels Group, down 3.99% on the day after reporting a slowdown in revenue growth. Taylor Wimpey, on the other hand, was the best performer, adding 1.93%. The index retreated in after hours trading following a late decline in US equities, heading into the Asian opening around 7,514, and with the daily chart showing that technical indicators turned lower within positive territory, as the index remains above its moving averages, these lasts, limiting chances of a steeper decline. In the 4 hours chart the index is also holding above all of its moving averages, with the 20 SMA retaining a strong bullish slope, yet technical indicators have turned sharply lower from overbought levels and are currently approaching their mid-lines, suggesting the index may extend its decline this Wednesday.
Support levels: 7,487 7,440 7,392
Resistance levels: 7,540 7,572 7,600
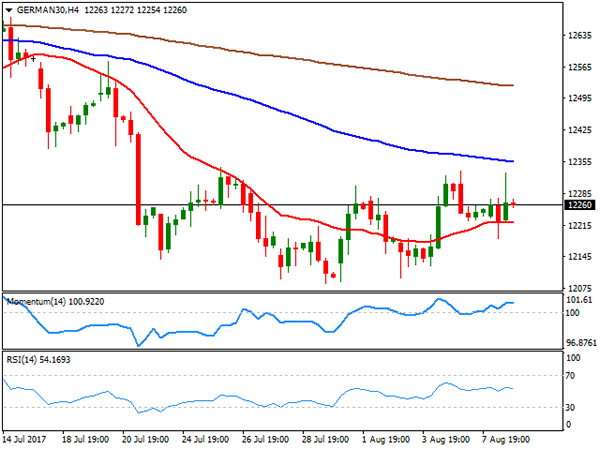
DAX
European equities trade mostly in the red, but the German DAX managed to shrug off the negative tone and settled at 12,292.05, up 35 points or 0.28%. Mood was undermined by poor Chinese and German trade data, as despite both economies presented wider-than-expected surplus, a decline in exports and imports triggered an alert. Helping European indexes to recover ground was EUR’s weakness at the end of the session. Within the DAX, Continental was the best performer, adding 2.12%, followed by E.ON, still on the positive track and up by 1.91%. Banks gave back their Monday’s gains, with Commerzbank leading decliners, down 1.29% and Deutsche Bank ending the day 0.58% lower. The index retains a negative tone according to the daily chart, as a bearish 20 DMA keeps capping advances, whilst technical indicators remain within negative territory, although lacking directional strength. In the 4 hours chart, the index settled above a horizontal 20 SMA but still below bearish 100 and 200 SMAs, whilst technical indicators also lack directional strength, but stand above their mid-lines.
Support levels: 12,210 12,174 12,128
Resistance levels: 12,275 12,323 12,381