
The EUR/USD currency pair
Technical indicators of the currency pair:
Prev Open: 1.17600
Open: 1.17572
% chg. over the last day: -0.02
Day’s range: 1.17554 – 1.17809
52 wk range: 1.0637 – 1.2012
The US dollar shows ambiguous results against currency majors. EUR/USD quotes are consolidating in the range of 1.1750-1.1780. Investors continue to monitor the progress of the new stimulus package for the US economy. ECB officials are concerned about the prospects for economic recovery in the Eurozone. The regulator is ready to expand financial incentives if necessary. We recommend opening positions from key levels.
Today, the publication of important economic reports is not planned.
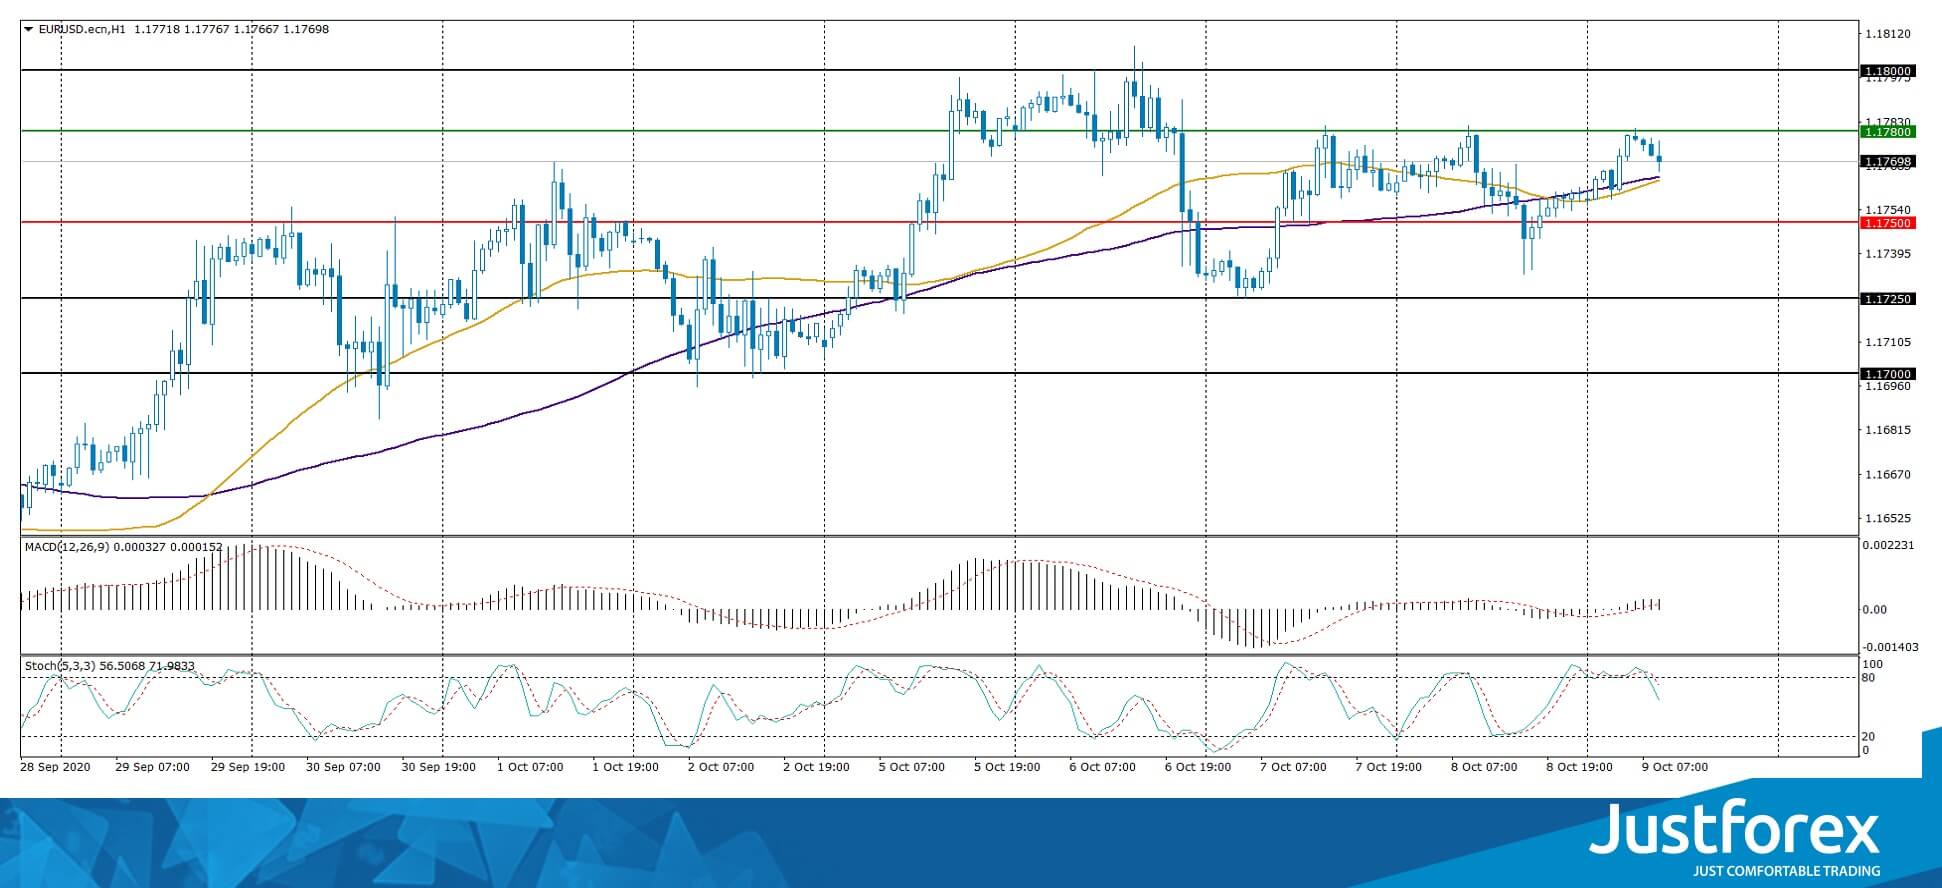
Indicators do not give accurate signals: 50 MA has crossed 200 MA.
The MACD histogram has started growing, which indicates the bullish sentiment.
Stochastic Oscillator is in the neutral zone, the %K line is below the %D line, which gives a signal to sell EUR/USD.
Trading recommendations
Support levels: 1.1750, 1.1725, 1.1700
Resistance levels: 1.1780, 1.1800, 1.1850
If the price fixes below 1.1750, EUR/USD quotes are expected to fall. The movement is tending to 1.1725-1.1700.
An alternative could be the growth of the EUR/USD currency pair to 1.1800-1.1840.
The GBP/USD currency pair
Technical indicators of the currency pair:
Prev Open: 1.29107
Open: 1.29113
% chg. over the last day: +0.01
Day’s range: 1.29133 – 1.29688
52 wk range: 1.1409 – 1.3516
GBP/USD quotes are in a sideways trend. The technical pattern is ambiguous. At the moment, the local support and resistance levels are 1.2930 and 1.2975, respectively. The trading instrument is tending to recover. Financial market participants expect additional drivers. The Brexit talks and a new stimulus package in the US Congress are still in the spotlight. Positions should be opened from key levels.
The UK has published a series of weak economic releases.
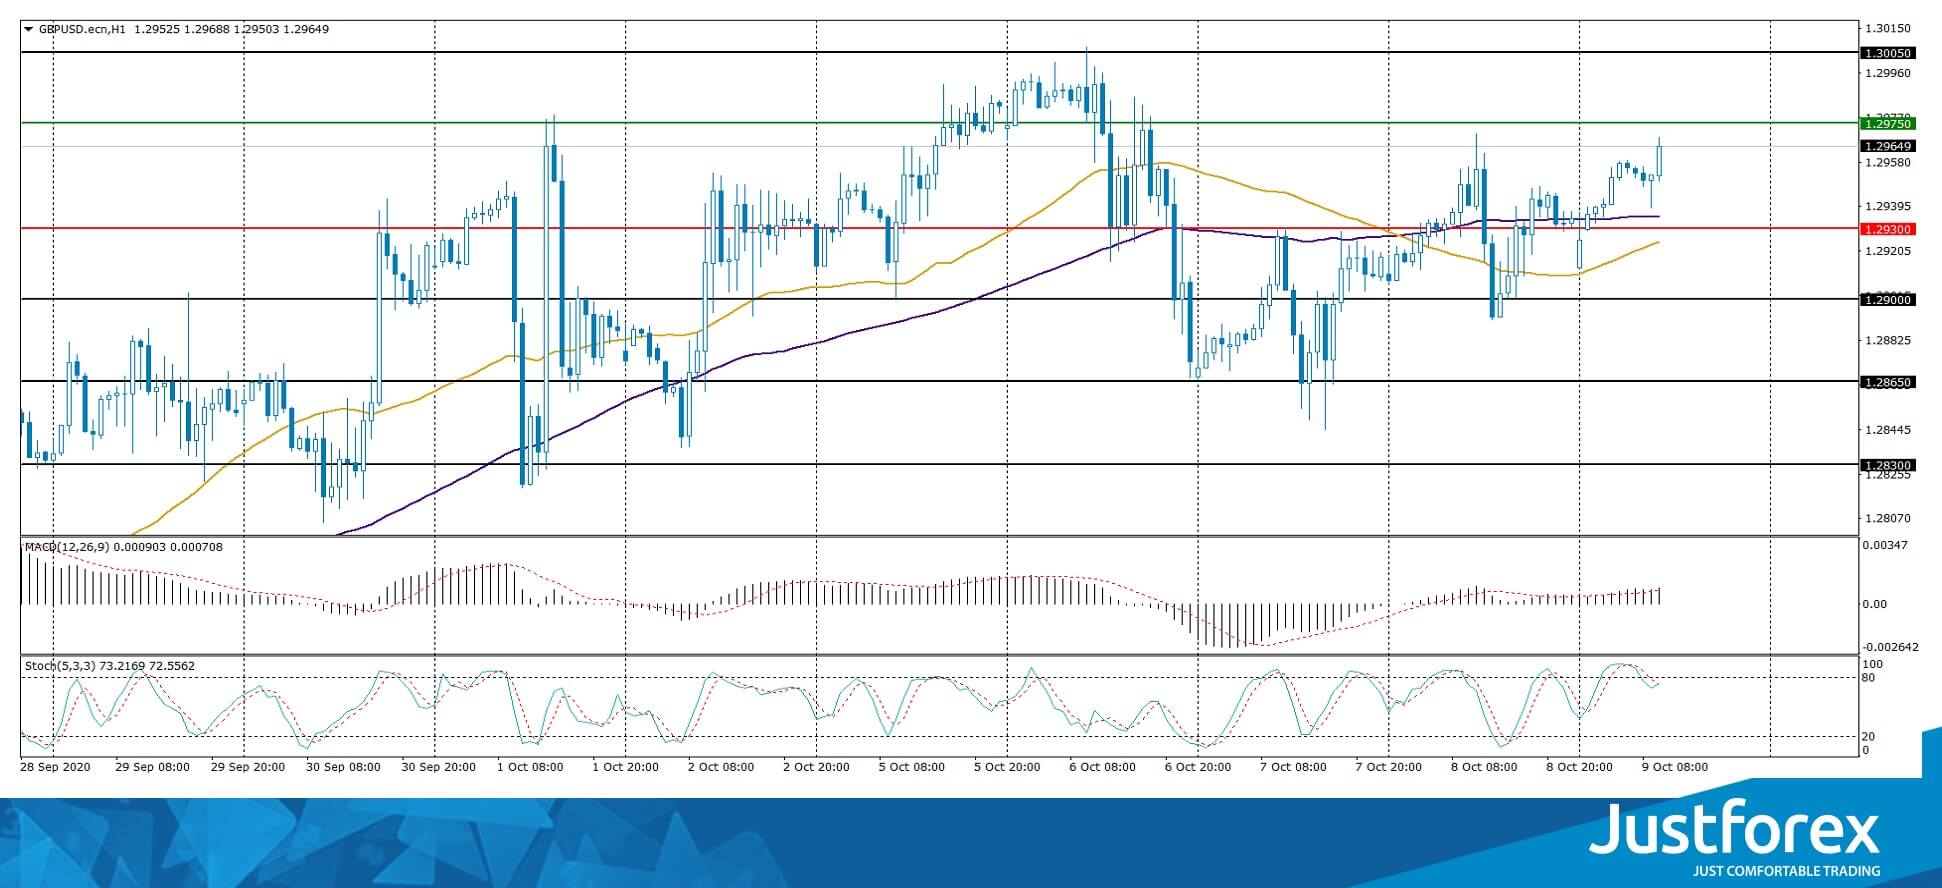
Indicators signal the power of buyers: the price has fixed above 100 MA.
The MACD histogram is in the positive zone, which indicates the bullish sentiment.
Stochastic Oscillator is located near the overbought zone, the %K line has crossed the %D line. There are no signals at the moment.
Trading recommendations
Support levels: 1.2930, 1.2900, 1.2865
Resistance levels: 1.2975, 1.3000, 1.3050
If the price fixes above 1.2975, further growth of the GBP/USD currency pair is expected. The movement is tending to 1.3000-1.3030.
An alternative could be a drop in GBP/USD quotes to 1.2900-1.2870.
The USD/CAD currency pair
Technical indicators of the currency pair:
Prev Open: 1.32596
Open: 1.31949
% chg. over the last day: -0.45
Day’s range: 1.31703 – 1.31976
52 wk range: 1.2949 – 1.4669
The USD/CAD currency pair shows a steady downtrend. The trading instrument has updated its two-week lows. The loonie is currently testing 1.3170. The 1.3210 level is the nearest resistance. USD/CAD quotes have the potential for further decline. We recommend paying attention to the dynamics of “black gold” prices. Positions should be opened from key levels.
At 15:30 (GMT+3:00), the report on Canada’s labor market will be published.
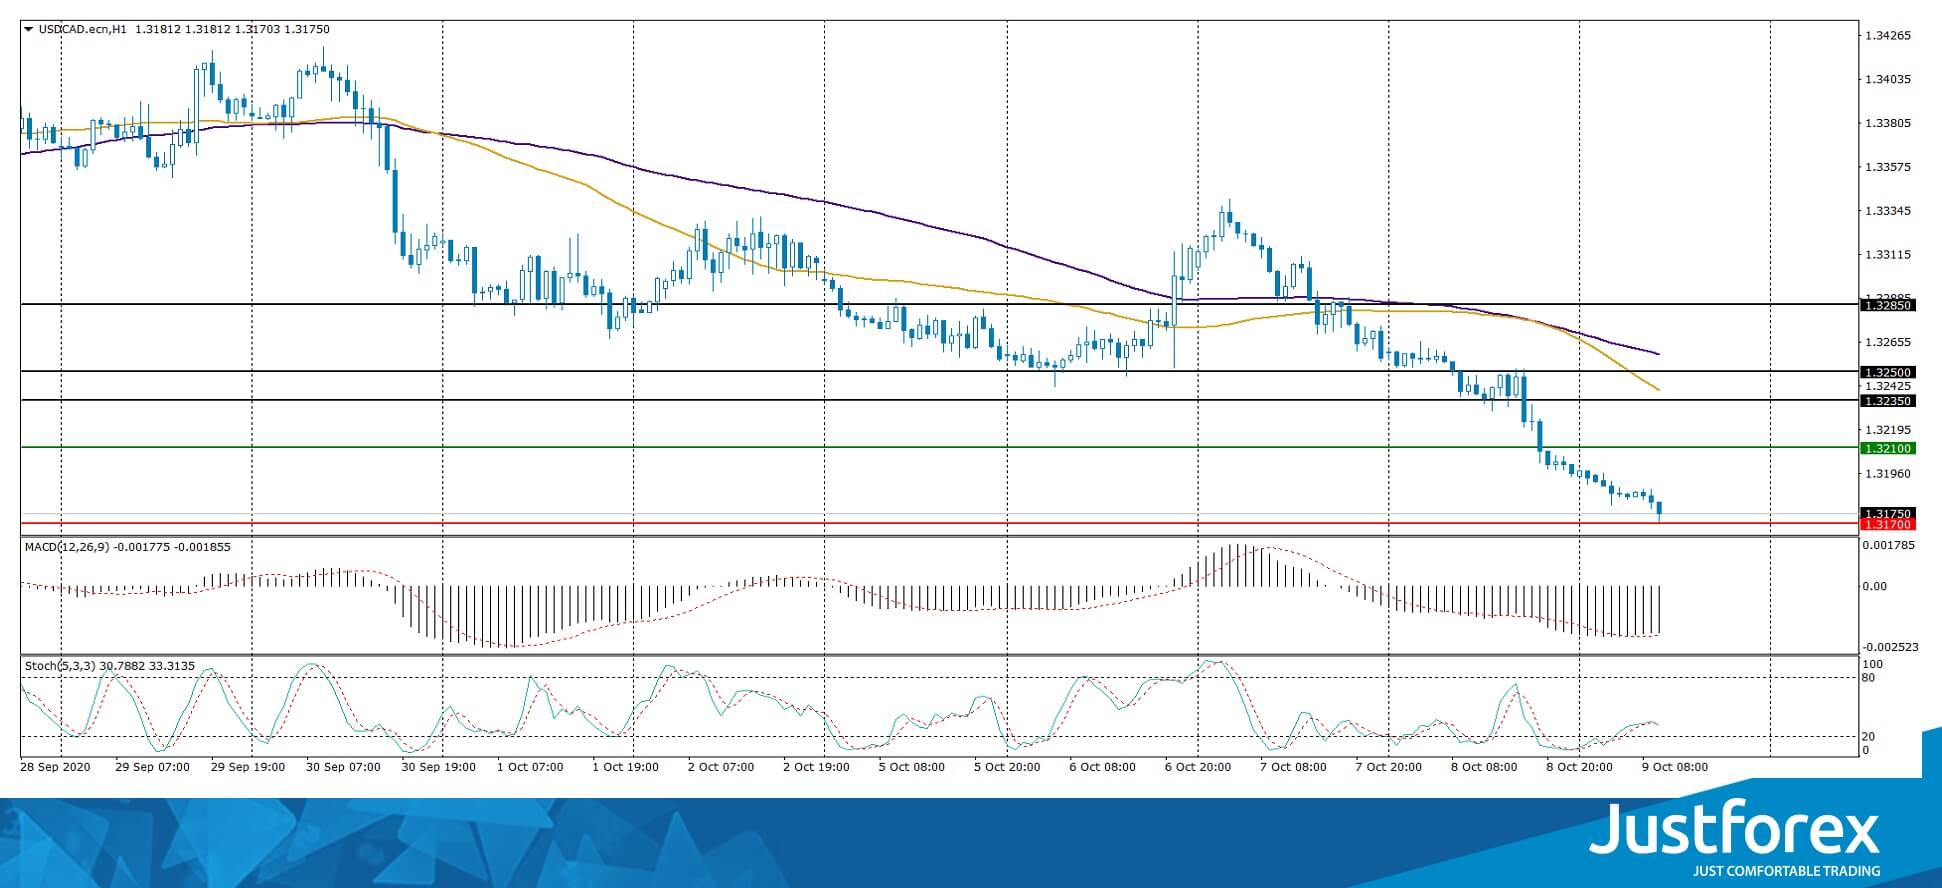
Indicators signal the power of sellers: the price has fixed below 50 MA and 100 MA.
The MACD histogram is in the negative zone, which indicates the bearish sentiment.
Stochastic Oscillator is in the neutral zone, the %K line has crossed the %D line. There are no signals at the moment.
Trading recommendations
Support levels: 1.3170, 1.3130, 1.3100
Resistance levels: 1.3210, 1.3235, 1.3250
If the price fixes below 1.3170, a further fall in USD/CAD quotes is expected. The movement is tending to 1.3140-1.3120.
An alternative could be the growth of the USD/CAD currency pair to 1.3240-1.3260.
The USD/JPY currency pair
Technical indicators of the currency pair:
Prev Open: 105.967
Open: 106.021
% chg. over the last day: +0.05
Day’s range: 105.808 – 106.034
52 wk range: 101.19 – 112.41
The USD/JPY currency pair continues to consolidate. There is no defined trend. Investors expect additional drivers. At the moment, the key support and resistance levels are 105.80 and 106.10, respectively. We recommend paying attention to the dynamics of US government bonds yield. Positions should be opened from key levels.
The news feed on Japan’s economy is calm.
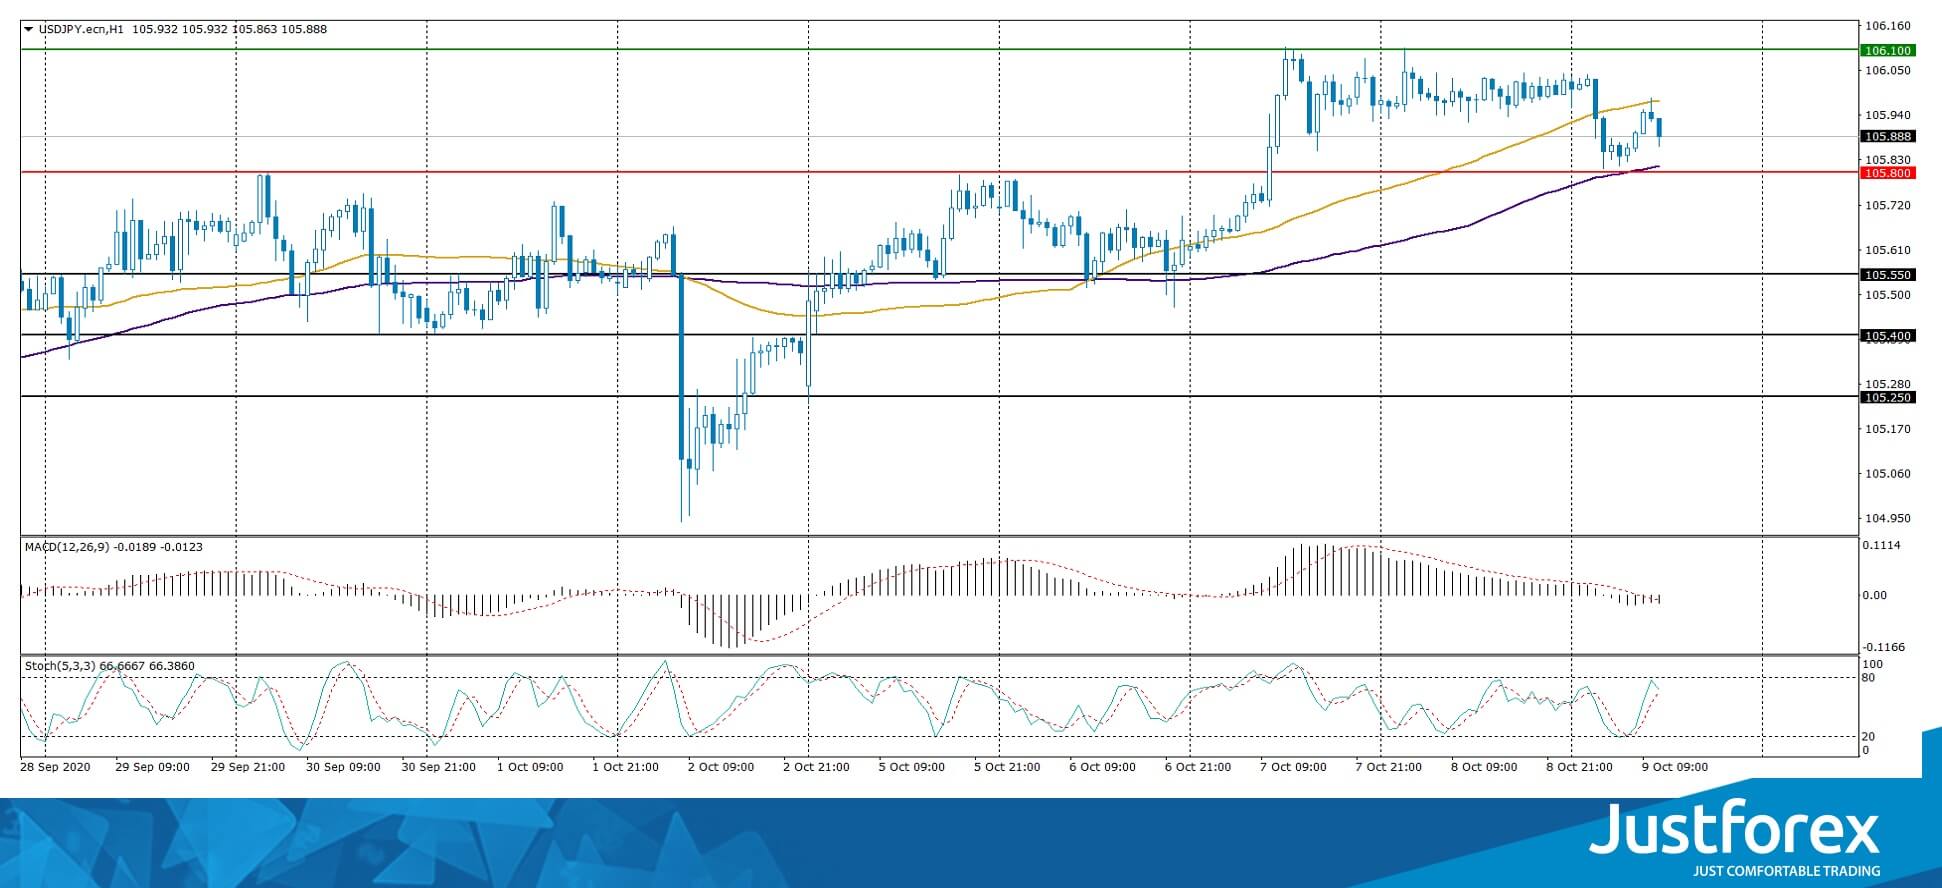
Indicators do not give accurate signals: the price has fixed between 50 MA and 100 MA.
The MACD histogram has started declining, which indicates the bearish sentiment.
Stochastic Oscillator is in the neutral zone, the %K line has started crossing the %D line. There are no signals at the moment.
Trading recommendations
Support levels: 105.80, 105.55, 105.40
Resistance levels: 106.10, 106.50
If the price fixes above 106.10, further growth of USD/JPY quotes is expected. The movement is tending to 106.40-106.60.
An alternative could be a decline in the USD/JPY currency pair to 105.60-105.40.


