
Key Highlights
- Crude oil price declined after retesting the $41.40 resistance area.
- A potential double top pattern is forming near $41.40 on the 4-hours chart of XTI/USD.
- The US CPI increased 1.4% in Sep 2020 (YoY), up from the last 1.3%.
- The US PPI (to be released today) is likely to rise 0.2% in Sep 2020 (YoY), up from -0.2%.
Crude Oil Price Technical Analysis
Earlier this month, crude oil price climbed higher above the $40.50 resistance against the US Dollar. The price retested the $41.40 resistance, where it faced a strong selling interest.
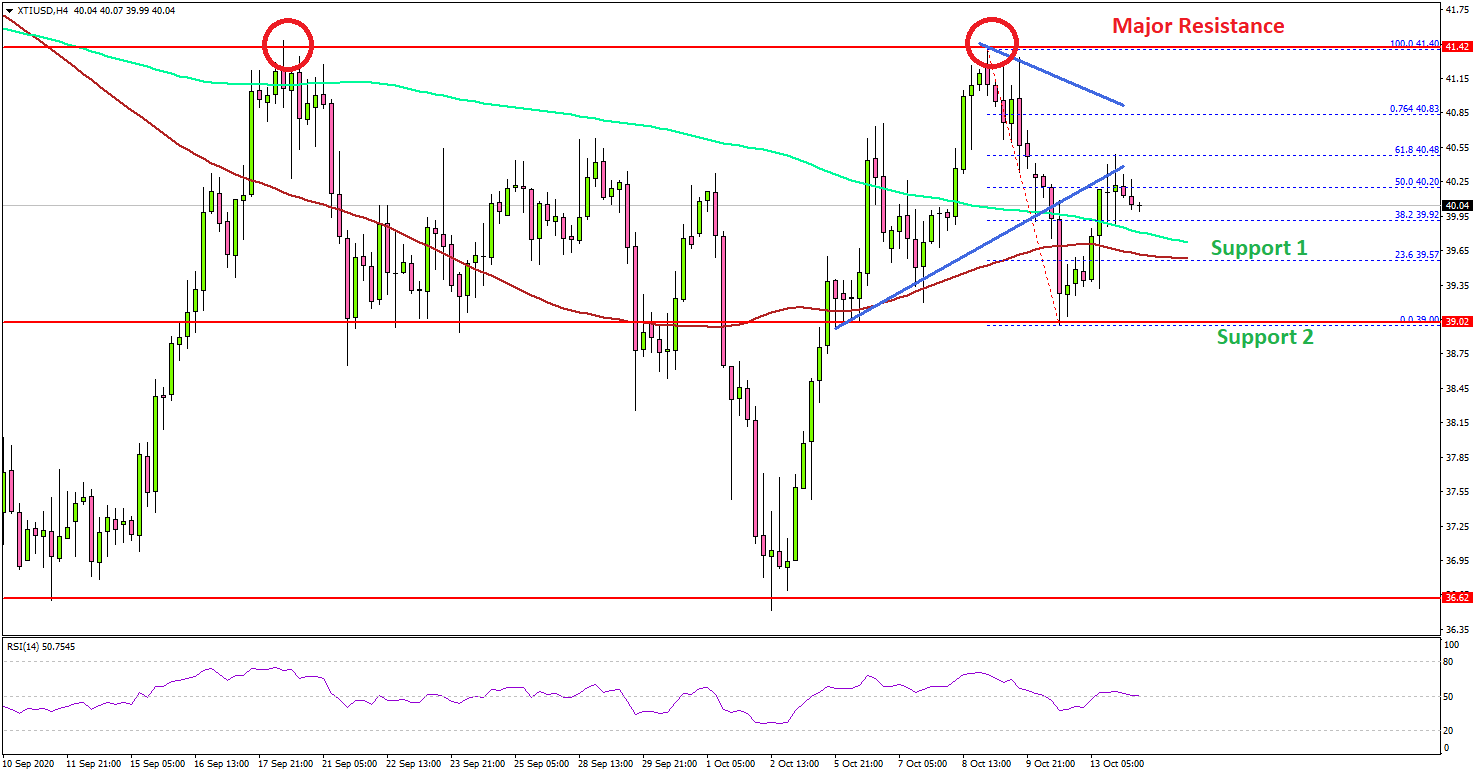
Looking at the 4-hours chart of XTI/USD, the price traded as high as $41.40 and declined below $41.00. There was a break below the $40.50 and $40.00 support levels. Moreover, the price spiked below the 100 simple moving average (4-hours, red) and 200 simple moving average (4-hours, green).
However, it found support near the $39.00 level (a multi-touch zone). The price recovered above the $40.00 level, but it seems to be facing a strong resistance above $40.50.
More importantly, it seems like there is a potential double top pattern forming near $41.40 on the same chart. If there is a downside break below the $39.00 support, there are high chances of a sharp decline towards the $37.25 and $37.00 support levels.
Conversely, a clear break above the $41.40 and $41.50 resistance levels could will invalidate the double top pattern, and the price might continue to rise.
Fundamentally, the US Consumer Price Index for Sep 2020 was released yesterday by the US Bureau of Labor Statistics. The market was looking for a rise of 1.3% compared with the same month a year ago.
The actual result was similar to the forecast, as the US CPI increased 1.4% in Sep 2020 (YoY), up from the last 1.3%. The Core CPI increased 1.7%, less than the market forecast of 1.8%.
The report added:
The index for used cars and trucks continued to rise sharply and accounted for most of the monthly increase in the seasonally adjusted all items index. The food index was unchanged, with an increase in the food away from home index offsetting a decline in the food at home index.
Overall, crude oil price could nosedive if it breaks the $39.00 support. Looking at EUR/USD, the pair started a major downside correction from the 1.1830 high. Similarly, GBP/USD corrected lower from the 1.3082 high.
Economic Releases to Watch Today
- ECB’s President Lagarde speech.
- US Producer Price Index Sep 2020 (YoY) – Forecast +0.2%, versus -0.2% previous.


