
Key Highlights
- USD/JPY started a downward move after it failed to surpass the 106.00 resistance.
- It traded below a key bullish trend line with support at 105.60 on the 4-hours chart.
- EUR/USD extended its decline below 1.1720, GBP/USD revered gains from 1.3050.
- The US Retail Sales could increase 0.7% in Sep 2020 (MoM), up from +0.6%.
USD/JPY Technical Analysis
After a couple of failed attempts near 106.00, the US Dollar reacted to the downside against the Japanese Yen. USD/JPY broke the 105.80 and 105.60 support levels to move into a short-term bearish zone.
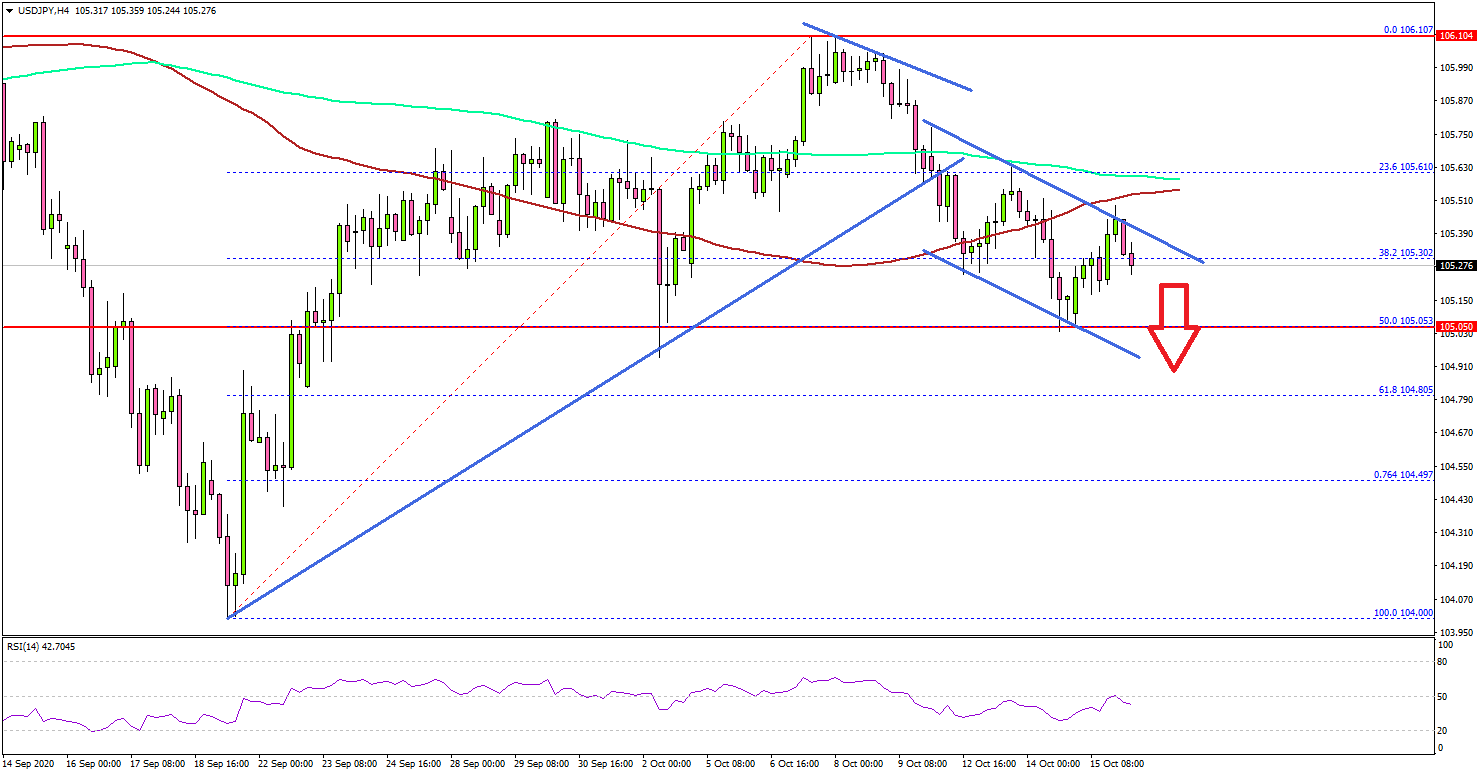
Looking at the daily chart, the pair topped at 106.10 before it started a fresh decline. There was a break below a key bullish trend line with support at 105.60. The pair even settled below 105.50, the 200 simple moving average (green, 4-hours), and the 100 simple moving average (red, 4-hours).
There was a break below the 38.2% Fib retracement level of the main upward move from the 104.00 low to 106.10 high. However, the pair tested the main 105.00 support.
The 50% Fib retracement level of the main upward move from the 104.00 low to 106.10 high is also near 105.00. Therefore, a clear break below the 105.00 support could spark a sharp decline. The next major support is near the 104.50 level.
Conversely, the pair could start a fresh increase from the 105.00 support. To move into a positive zone, the pair must clear 105.50 and the 100 SMA. The main resistance is still near 106.00 and 106.10.
Fundamentally, the US Initial Jobless Claims figure for the week ending Oct 10, 2020 was released yesterday by the US Department of Labor. The market was looking for a decline from 840K to 825K.
The actual result was disappointing, as the US Initial Jobless Claims increased to 898K. Besides, the last reading was revised up from 840K to 845K.
The report added:
The 4-week moving average was 866,250, an increase of 8,000 from the previous week’s revised average. The previous week’s average was revised up by 1,250 from 857,000 to 858,250.
Looking at GBP/USD, the pair decline sharply from the 1.3065 level and traded below 1.2950. Moreover, EUR/USD traded below the 1.1750 and 1.1720 support levels.
Upcoming Economic Releases
- Euro Zone CPI Sep 2020 (YoY) – Forecast -0.3%, versus -0.3% previous.
- Euro Zone CPI Sep 2020 (MoM) – Forecast +0.1%, versus -0.4% previous.
- US Retail Sales Sep 2020 (MoM) – Forecast +0.7%, versus +0.6% previous.
- US Industrial Production Sep 2020 (MoM) – Forecast +0.5%, versus +0.4% previous.


