
The EUR/USD currency pair
Technical indicators of the currency pair:
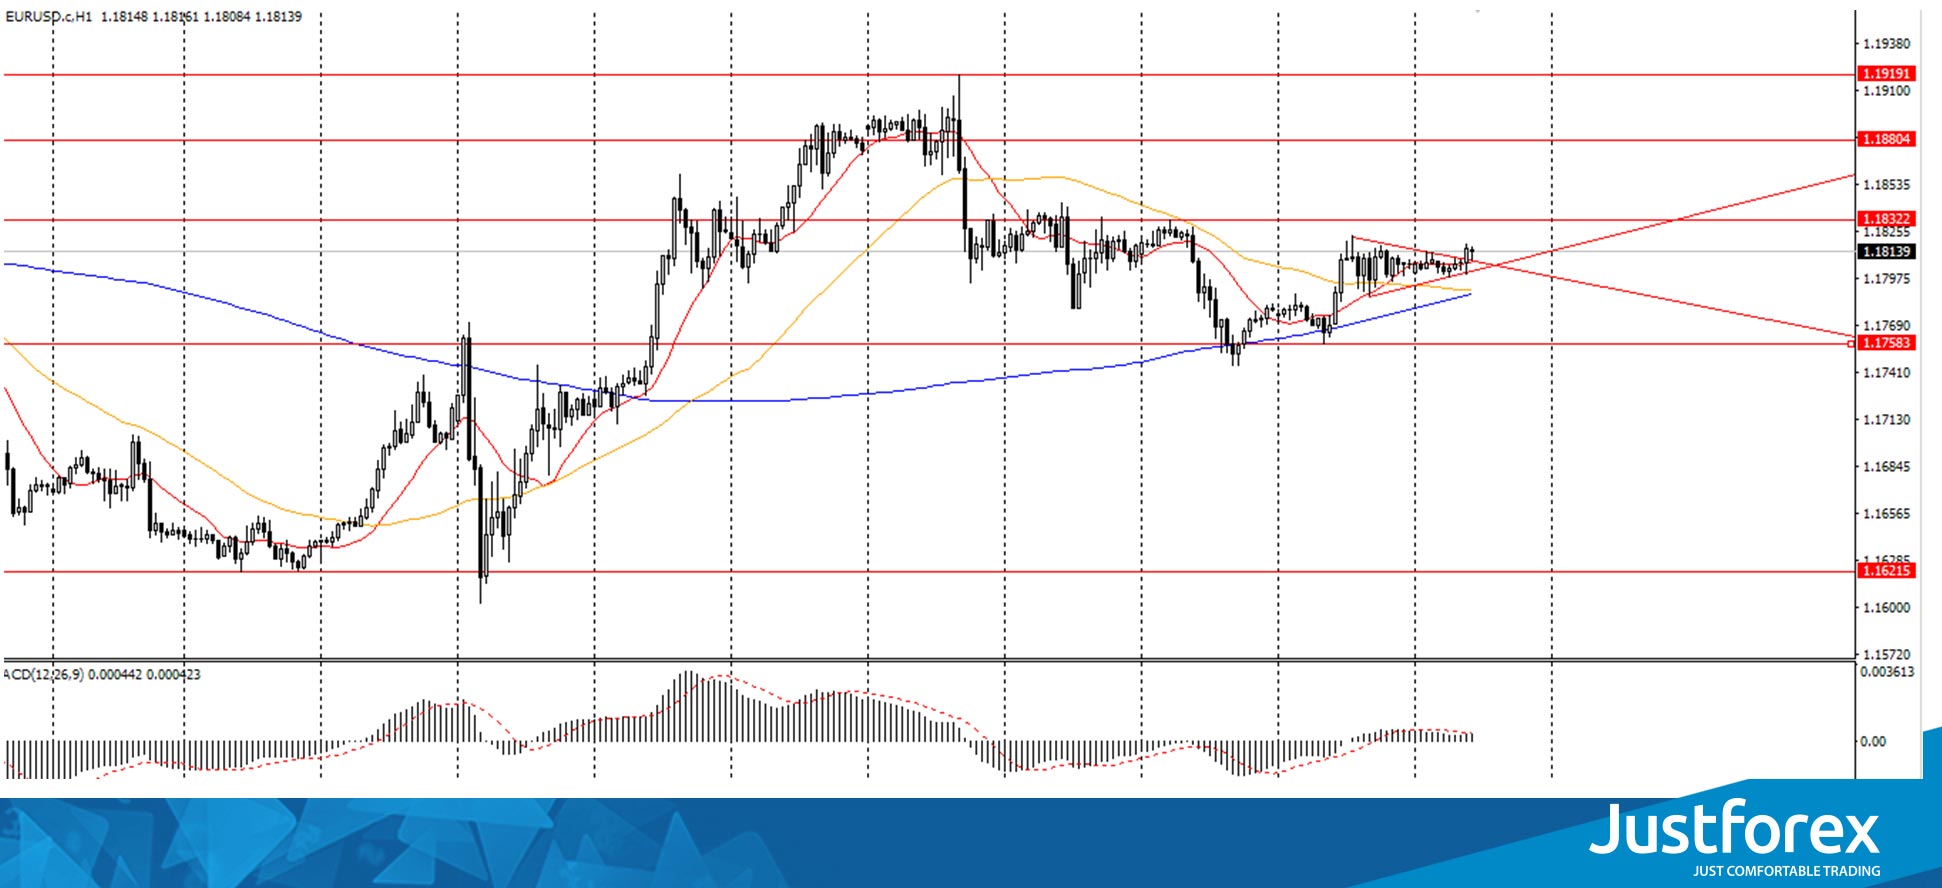
Prev Open: 1.1775
Prev Close: 1.1805
% chg. over the last day: +0.25%
Yesterday, the EUR/USD currency pair was traded upward and showed a positive trend of 0.25%. This morning the pair is being traded in a narrow daily range near the previous day’s close price: 1.1797 – 1.1812. If you look at the chart, a technical analysis figure of an Ascending Triangle is drawn now. On the hourly timeframe, the price is being traded above the moving average MA 200. On the H4 timeframe, the situation is similar. The MACD indicator is in the positive zone. Based on the above, it is probably worth considering purchases while the price is above MA 200.
Trading recommendations
Support levels: 1.1758, 1.1621
Resistance levels: 1.1832, 1.1880, 1.1920
The main scenario for trading EUR/USD is continued growth towards 1.1832 (November 11 high)
Alternative scenario: if the price fixes below MA 200 on the H1 timeframe, the currency pair is likely to decline to 1.1620.
The GBP/USD currency pair
Technical indicators of the currency pair:
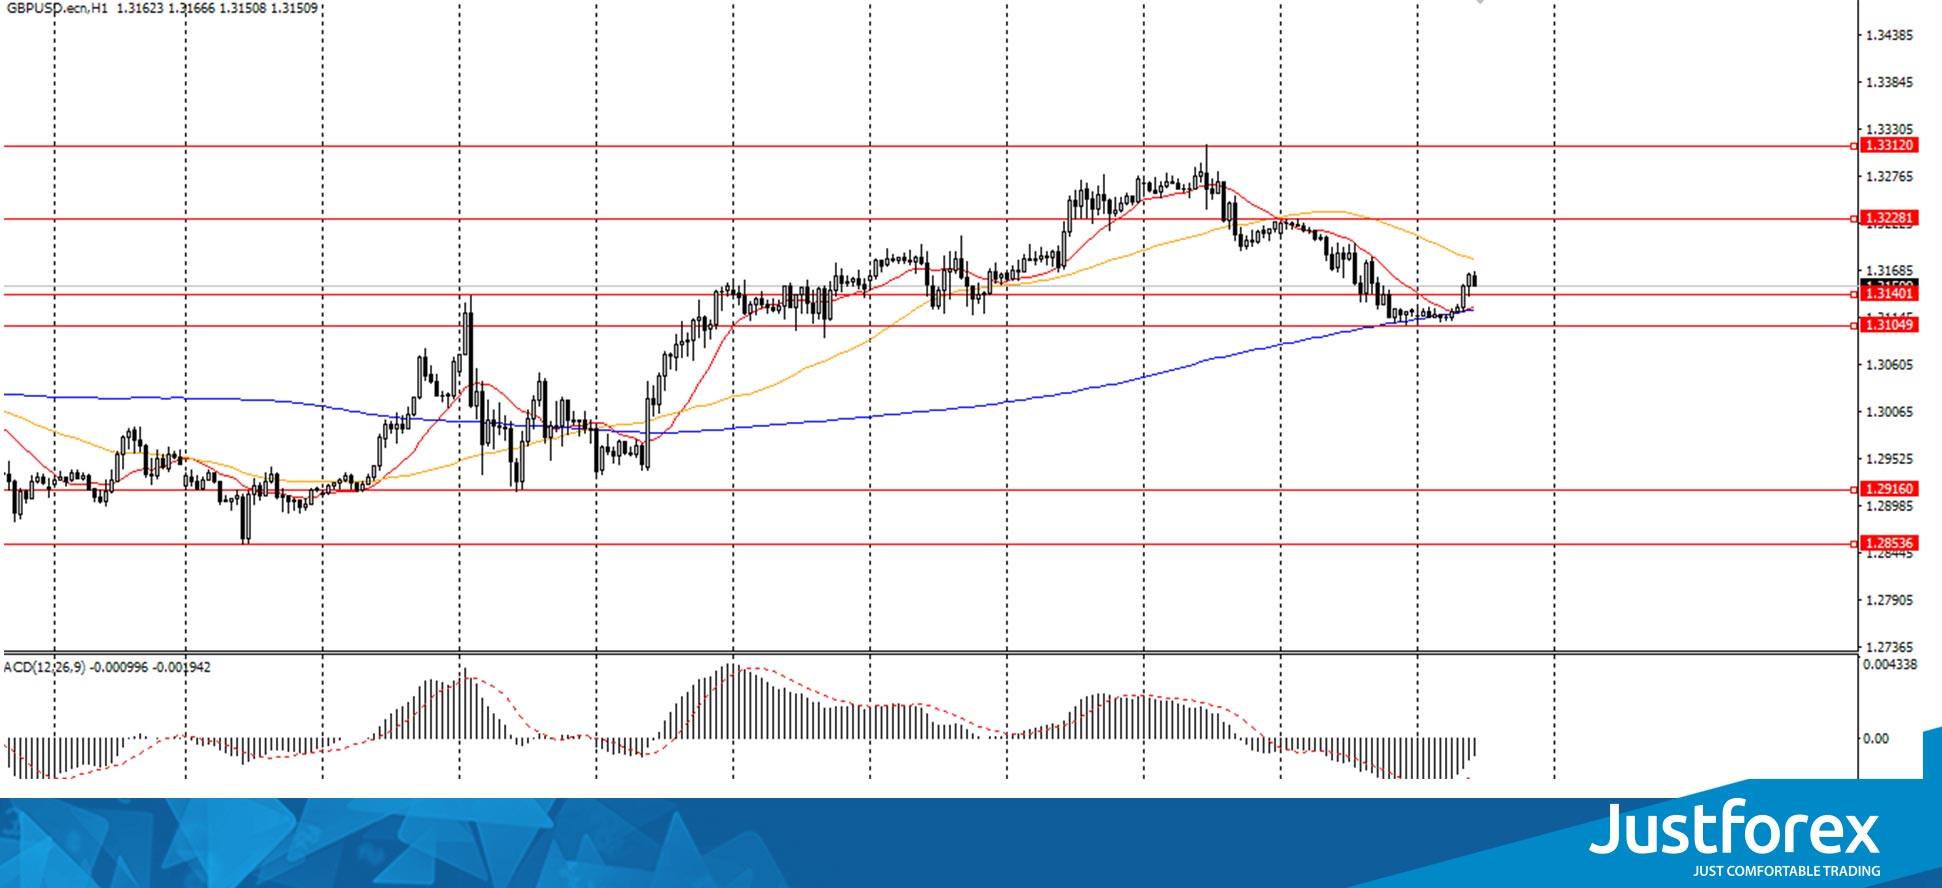
Prev Open: 1.3210
Prev Close: 1.3122
% chg. over the last day: -0.67
Yesterday, the GBP/USD currency pair was traded downward and closed the day with -0.67%. Today, the currency pair has been trading in the range of $1.3105-50. On the hourly chart, GBP/USD is testing the MA 200 line on the H1 timeframe. The situation is similar on the four-hour chart. The MACD indicator is still in the negative zone. Based on the above, it is probably worth looking for buy entry points, while the GBP/USD is still above MA 200 H1.
Trading recommendations
Support levels: 1.3105, 1.2915, 1.2850
Resistance levels: 1.3140, 1.3228, 1.3312
The main scenario for trading GBP/USD: if the price fixes above the level of 1.3140, GBP/USD quotes can move to the level of $1.3228 (November 12 high).
Alternative scenario: if the price fixes below the moving average MA 200 on H1, then GBP/USD may fall to $1.2915.
News feed for 2020.11.13:
US producer price index at 15:30 (GMT+2);
Speech by the Bank of England Governor Bailey at 18:00 (GMT+2).
The USD/JPY currency pair
Technical indicators of the currency pair:
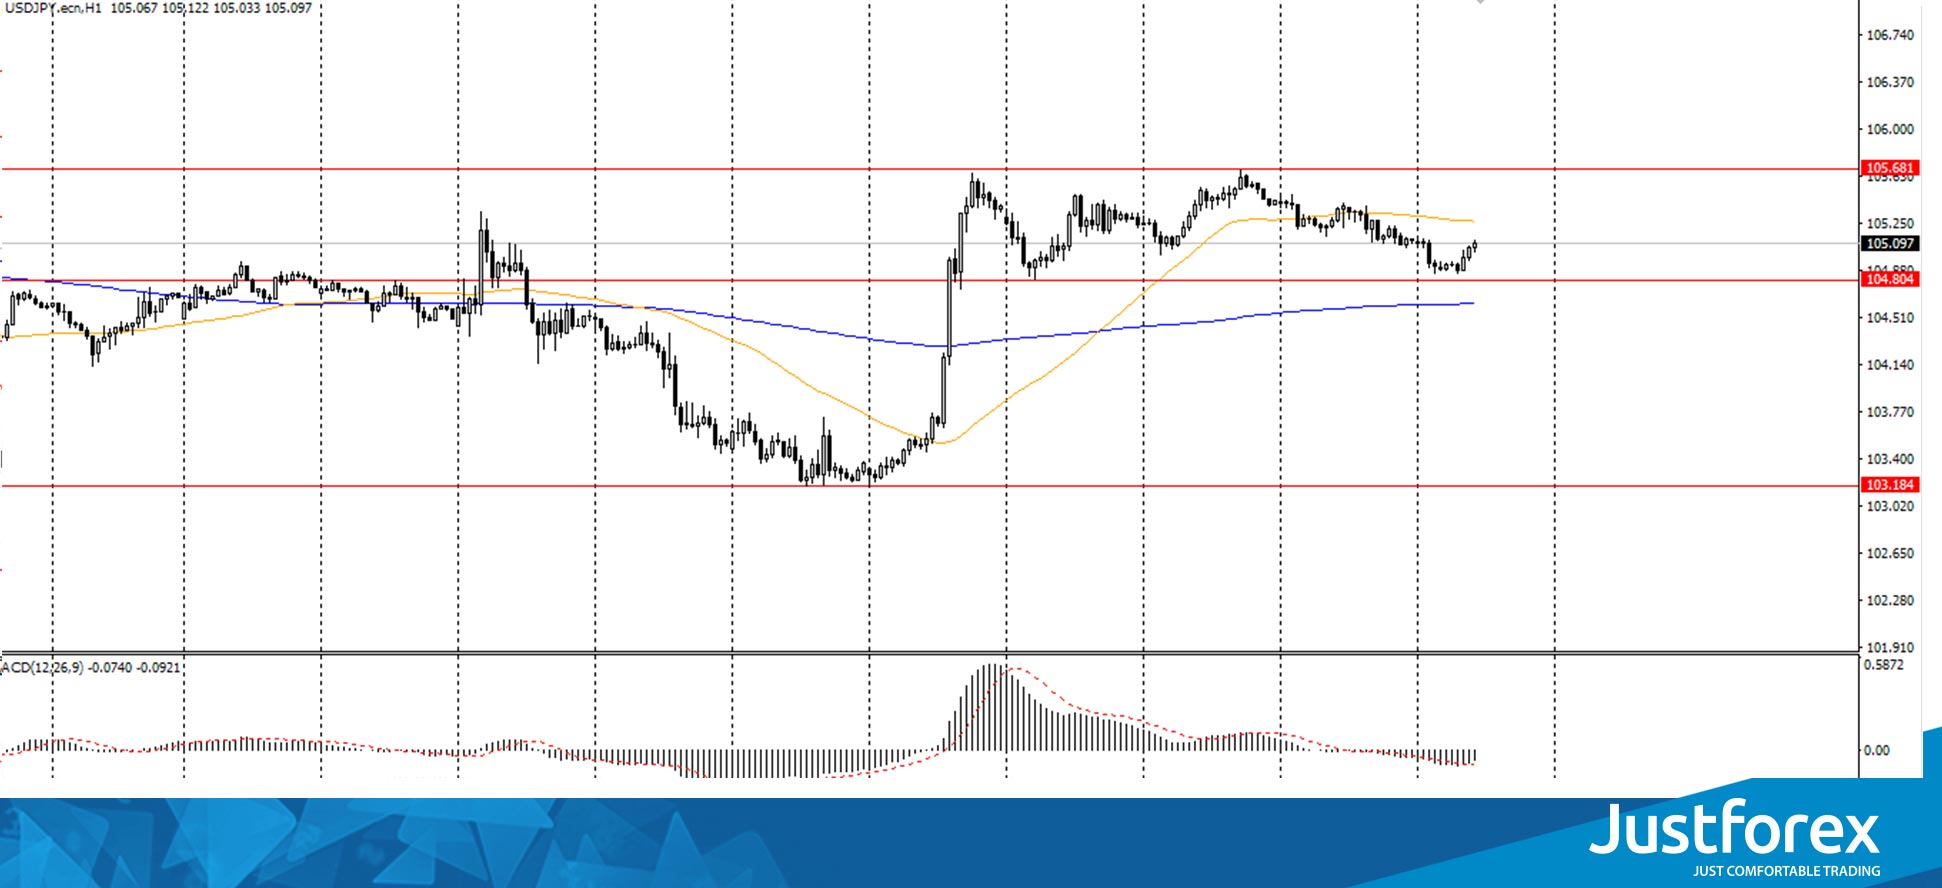
Prev Open: 105.402
Prev Close: 105.118
% chg. over the last day: -0.27
Yesterday, the USD/JPY currency pair was traded downward and showed a 0.27% fall. The currency pair has fallen slightly today, dropping to Y104.85. On the hourly chart, USD/JPY is still being traded above the MA 200 on the H1 timeframe. On the four-hour chart, the pair remains below the MA 200 on the H4 timeframe. Based on the above, it is worth looking for buy entry points at the end of the correction, while the price remains above MA 200 H1.
Trading recommendations
Support levels: 104.80, 103.18
Resistance levels: 105.67
The main scenario for trading USD/JPY is the continuation of the upward movement to the level of 105.67 (November 11 high).
An alternative scenario assumes consolidation below MA 200 H1, followed by a decline to 103.20 (Nov 9 low).
News feed for 2020.11.13:
US producer price index at 15:30 (GMT+2)
The USD/CAD currency pair
Technical indicators of the currency pair:
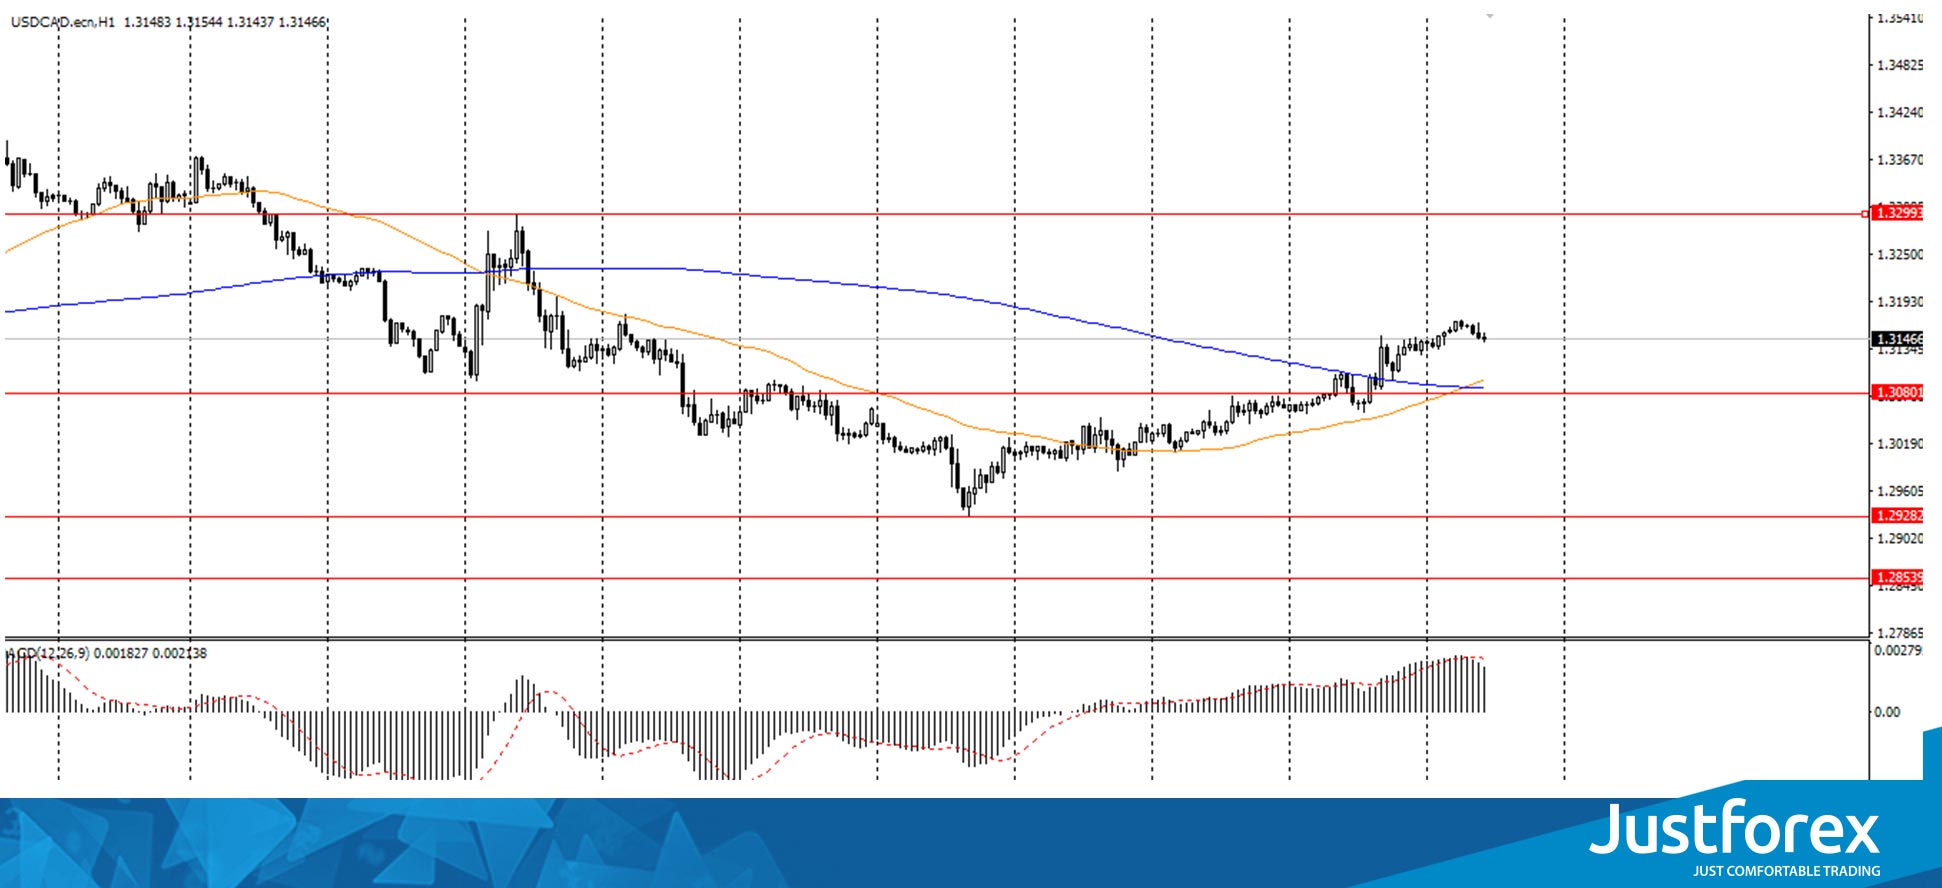
Prev Open: 1.3059
Prev Close: 1.3142
% chg. over the last day: +0,63
Yesterday, the USD/CAD pair was traded upward and closed with +0.63%. Today, the pair has also increased slightly, rising to $1.3170. On the H1 timeframe, the pair broke through the MA 200. On the four-hour chart, the price has not yet tested the moving average. Based on the above, it is worth looking for buy entry points at the correction, while the price remains above MA 200 H1. We recommend paying attention to how the price will behave when approaching the moving average on the H4 timeframe.
Trading recommendations
Support levels: 1.3080, 1.2928
Resistance levels: 1.3297
The main scenario for trading USD/CAD: it is necessary to look for a buy entry point upon a pullback to the level of 1.3080, on the H1 timeframe. The currency pair may reach the level of 1.3297.
Alternative scenario: if the price breaks through the level of 1.3080 and fixes below the MA 200, you can consider a sell position to the level of 1.2928.
News feed for 2020.11.13:
US producer price index at 15:30 (GMT+2)


